IRVINE, Calif.--(BUSINESS WIRE)--CoreLogic® (NYSE: CLGX), a leading global property information, analytics and data-enabled solutions provider, today released “Evaluating the Housing Market Since the Great Recession.” This report details the remarkable 11-year economic cycle surrounding the last U.S. housing market downturn, examining the boom and bust years between 2006 and 2011 and the ensuing recovery, with data through December 2017.
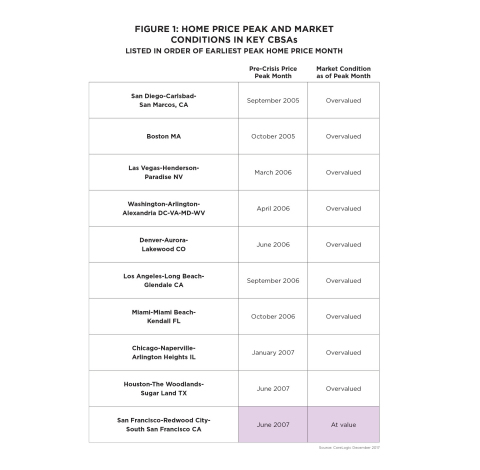
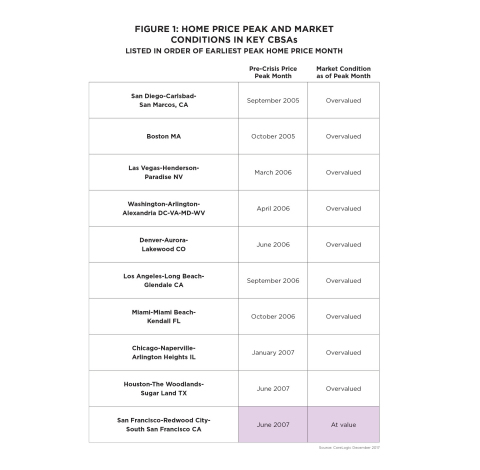
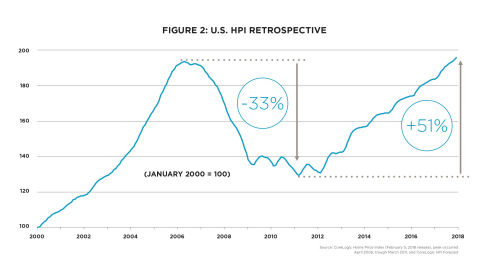
Residential home prices began to peak in some parts of the country as early as 2005 (Figure 1). Home prices collapsed in 2007 (Figure 2), when Wall Street began to back out of residential mortgage-backed securities. After falling 33 percent during the recession, prices in most markets have returned to peak levels, growing 51 percent nationally since bottoming out in March 2011. The average home price is now 1 percent higher than it was at the peak in 2006, and the average year-over-year home equity gain was $14,888 in the third quarter of 2017*. This indicates the housing market has widely recovered.
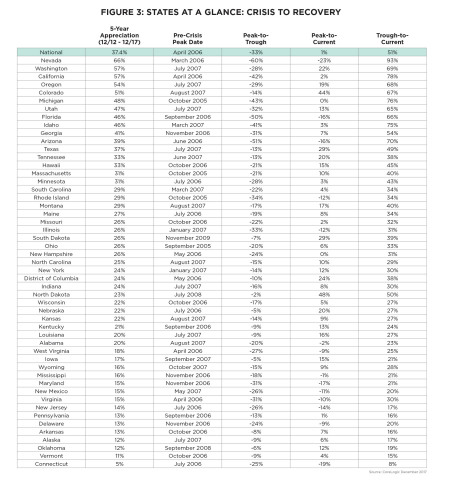
While the nation’s average home price has stabilized, not all of the 50 states are back to their pre-recession price levels. Nevada suffered the biggest drop during the recession, with a 60 percent peak-to-trough decline in home prices (Figure 3). Even after experiencing a 93 percent increase from its trough-to-current home price level, Nevada home prices are still 23 percent below the pre-recession peak, and 9 percent of mortgaged properties remained underwater in the third quarter of 2017.
Some states faired relatively well through the national housing downturn, with 10 posting peak-to-trough declines of less than 10 percent. North Dakota’s peak-to-trough decline was the smallest at 2 percent. Due in part to the energy boom, North Dakota home prices have risen 48 percent above the prior peak in July 2008. Similarly, Nebraska and Iowa home prices both dropped by 5 percent during the recession. Nebraska now stands 27 percent higher than its lowest home price level during the recession, and Iowa is now 15 percent above its prior peak in 2006.
“Homeowners in the United States experienced a run-up in prices from the early 2000s to 2006, and then saw the trend reverse with steady declines through 2011,” said Dr. Frank Nothaft, chief economist for CoreLogic. “After reaching bottom in 2011, our national price index is up more than 50 percent. West Coast states, such as California, Washington and Oregon are seeing some of largest trough-to-current growth rates in home prices. Greater demand and lower supply – as well as booming job markets – have given some of the hardest-hit housing markets a boost in home prices. Yet, many are still not back to pre-crash levels.”
Local job market dynamics and other factors helped determine the severity of the housing downturn at the regional level. Las Vegas, Miami and Chicago each arrived at their respective peaks at different times during the boom and experienced significant peak-to-trough home price declines during the recession. These markets have been slower to recover and their home prices are below their pre-recession peaks. Other metro areas such as San Francisco and Denver, which both have technology sectors and low unemployment, have experienced consistent home price growth. In the third quarter of 2017, the average year-over-year equity gain in San Francisco and Denver was $73,217, and $22,102, respectively, and only 1 percent of homes in those markets remained underwater.
*December 2017 equity data was revised. Revisions are standard, and to ensure accuracy CoreLogic incorporates newly released data to provide updated results.
Methodology
The data in this report represents home price activity reported through December 2017 and home equity data through the third quarter of 2017.
The CoreLogic HPI™ is built on industry-leading public record, servicing and securities real-estate databases, and incorporates more than 40 years of repeat-sales transactions for analyzing home price trends. Generally released on the first Tuesday of each month (with an average five-week lag), the CoreLogic HPI is designed to provide an early indication of home price trends by market segment and for the “Single-Family Combined” tier. The report represents the most comprehensive set of properties, including all sales for single-family attached and single-family detached properties. The indexes are fully revised with each release and employ CoreLogic valuation techniques to signal turning points in the market sooner than other reports. The CoreLogic HPI provides measures for multiple market segments (referred to as tiers) based on property type, price, time between sales, loan type (conforming vs. non-conforming) and distressed sales. Broad national coverage is available from the national level down to ZIP Code, including non-disclosure states.
CoreLogic Market Condition Indicators (MCI) analysis categorizes home prices in individual markets as undervalued, at value or overvalued. The MCI analysis defines an overvalued housing market as one in which home prices are at least 10 percent higher than the long-term, sustainable level. It defines an undervalued housing market as one in which home prices are at least 10 percent below the sustainable level.
CoreLogic Home Equity Data: The amount of equity for each property is determined by comparing the estimated current value of the property against the mortgage debt outstanding (MDO). If the MDO is greater than the estimated value, the property is determined to be in a negative equity position. If the estimated value is greater than the MDO, the property is determined to be in a positive equity position. The data is first generated at the property level and aggregated to higher levels of geography. CoreLogic data includes more than 50 million properties with a mortgage, which accounts for more than 95 percent of all mortgages in the U.S. CoreLogic uses public record data as the source of the MDO, which includes both first-mortgage liens and second liens. This data is adjusted for amortization and home equity utilization in order to capture the true level of MDO for each property. The calculations are not based on sampling, but rather on the full data set, in order to avoid potential adverse selection. The current value of the property is estimated using a suite of proprietary CoreLogic valuation techniques, including valuation models and the CoreLogic Home Price Index (HPI). In August 2016, the CoreLogic HPI was enhanced to include nearly one million additional repeat sales records from proprietary data sources that provide greater coverage in home price changes nationwide. The increased coverage is particularly useful in 14 non-disclosure states. Additionally, a new modeling methodology has been added to the HPI to weight outlier pairs, ensuring increased consistency and reducing month-over-month revisions.
The use of the enhanced CoreLogic HPI was implemented with the Equity report in the second quarter of 2016. Only data for mortgaged residential properties that have a current estimated value are included. There are several states or jurisdictions where the public record, current value or mortgage data coverage is thin and have been excluded from the analysis. However, these instances account for fewer than 5 percent of the total U.S. population.
Source: CoreLogic
The data provided is for use only by the primary recipient or the primary recipient's publication or broadcast. This data may not be re-sold, republished or licensed to any other source, including publications and sources owned by the primary recipient's parent company without prior written permission from CoreLogic. Any CoreLogic data used for publication or broadcast, in whole or in part, must be sourced as coming from CoreLogic, a data and analytics company. For use with broadcast or web content, the citation must directly accompany first reference of the data. If the data is illustrated with maps, charts, graphs or other visual elements, the CoreLogic logo must be included on screen or website. For questions, analysis or interpretation of the data, contact Alyson Austin at newsmedia@corelogic.com or Allyse Sanchez at corelogic@ink-co.com. Data provided may not be modified without the prior written permission of CoreLogic. Do not use the data in any unlawful manner. This data is compiled from public records, contributory databases and proprietary analytics, and its accuracy is dependent upon these sources.
About CoreLogic
CoreLogic (NYSE: CLGX) is a leading global property information, analytics and data-enabled solutions provider. The company’s combined data from public, contributory and proprietary sources includes over 4.5 billion records spanning more than 50 years and providing detailed coverage of property, mortgages and other encumbrances, consumer credit, tenancy, location, hazard risk and related performance information. The markets CoreLogic serves include real estate and mortgage finance, insurance, capital markets, and the public sector. CoreLogic delivers value to clients through unique data, analytics, workflow technology, advisory and managed services. Clients rely on CoreLogic to help identify and manage growth opportunities, improve performance and mitigate risk. Headquartered in Irvine, Calif., CoreLogic operates in North America, Western Europe and Asia Pacific. For more information, please visit www.corelogic.com.
CORELOGIC, the CoreLogic logo and CoreLogic HPI are trademarks of CoreLogic, Inc. and/or its subsidiaries.


