

Newsroom
Sorted by: Latest
-
Corporate Attorneys Carlton Ng and Maureen Wang Join Dorsey in Hong Kong
HONG KONG--(BUSINESS WIRE)--Attorneys Carlton Ng and Maureen Wang have joined Dorsey & Whitney in Hong Kong, the international law firm announced today. “Carlton and Maureen bring deep expertise in Hong Kong corporate markets,” said Janet Wong, Head of Dorsey’s Hong Kong office. “We are thrilled they have joined our office and bring their tremendous experience, further strengthening our strategic international capabilities.” “Their addition enhances the depth of our Hong Kong equity capital...

-
パリサー・キャピタルは、SMC株式会社の価値向上プランを公表します
ロンドン--(BUSINESS WIRE)--(ビジネスワイヤ) -- パリサー・キャピタル(以下「パリサー」といいます。)は本日、SMC株式会社(以下「SMC」といいます。)の上位25位以内の株主として、同社における大きくかつ長期的価値を解放するための可能性についてまとめた包括的なプレゼンテーションを公表しました。 市場の透明性を確保し、株主及びその他のステークホルダーからの関心の高まりに応えるため、パリサーは、「SMCの価値の最大化 - 企業価値の再評価を促す6,000億円の自社株買い」と題した詳細なプレゼンテーションを公表しました。本プレゼンテーションでは、日本、韓国、台湾、中国及び北米における空圧機器分野でのSMCの独自のグローバル・リーダーシップに関するパリサーの評価を示すとともに、同社の現在の評価上の乖離をもたらしている要因を特定し、SMCの慢性的な過小評価に対処してその潜在価値を全面的に解放するために必要な、具体的かつ実行可能性の高い施策を明らかにしています。 SMCは、強固な事業基盤、差別化された事業モデル及び競争優位性 - 規模、オペレーショナル・エクセレンス、及び...
-
Palliser Capital Publishes Value Enhancement Plan for SMC Corporation
LONDON--(BUSINESS WIRE)--Palliser Capital (“Palliser”), a top 25 shareholder of SMC Corporation (“SMC” or the “Company”), today published a comprehensive plan (“Value Enhancement Plan”) outlining the opportunities available to unlock substantial long-term value at the Company. To promote market transparency and respond to growing interest from shareholders and other stakeholders, Palliser has made public a detailed presentation titled “Maximising the Value of SMC Corporation – ¥600bn Share Buyb...
-
村田新款開關用途AMR磁性感測器開始量產,支援20nA低消耗電流與1.2V低電壓驅動
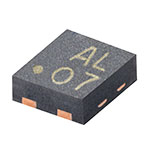
日本京都--(BUSINESS WIRE)--(美國商業資訊)-- 株式會社村田製作所(TOKYO: 6981)(以下簡稱「村田」)面向醫療健康設備及穿戴式設備,新開發了低功耗、低電壓驅動型AMR感測器「MRMS166R」「MRMS168R」,並已開始量產。 「MRMS166R」將AMR感測器的消耗電流控制在極低水準(1),並實現了低電壓驅動。是村田首款(2)同時實現平均消耗電流20nA與1.2V低電壓驅動的AMR感測器。 (1)(2) 根據村田調查,截至2026年4月26日。 主要特點 消耗電流大幅降低 AMR感測器「MRMS166R」在Vcc(3)為1.5V時平均消耗電流為20nA,可在極低的靜態電流下運行,即使在使用容量受限的鈕扣電池的設備中,也能夠實現長時間運行。 支援低電壓驅動 「MRMS166R」可從1.2V開始工作,因此在電源條件受限的設備中也能夠穩定運行。 小型封裝 採用外形尺寸1.0×1.0mm的小型封裝,可減少基板面積,便於搭載於小型設備。 (3) Vcc:指電源電壓,是驅動AMR感測器運行所需的電壓。 主要用途 醫療健康設備(膠囊內視鏡、醫療貼片、CGM)、穿戴式...
-
Murata Launches Ultra-Low Power AMR Sensors to Boost Battery Life in Healthcare and Wearables Devices
KYOTO, Japan--(BUSINESS WIRE)--Murata starts the mass production of the ultralow current consumption, low voltage operation AMR sensors for healthcare and wearable devices....

-
村田新款开关用途AMR磁性传感器开始量产,支持20nA低消耗电流与1.2V低电压驱动
日本京都--(BUSINESS WIRE)--(美国商业资讯)-- 株式会社村田制作所(TOKYO: 6981)(以下简称"村田")面向医疗健康设备及可穿戴设备,新开发了低功耗、低电压驱动型AMR传感器"MRMS166R""MRMS168R",并已开始量产。 "MRMS166R"将AMR传感器的消耗电流控制在低微水平(1),并实现了低电压驱动。是村田首款(2)同时实现了平均消耗电流20nA与1.2V低电压驱动的AMR传感器。 (1)(2) 由村田调查得出,截至2026年4月26日。 主要特点 消耗电流大幅降低 AMR传感器"MRMS166R"在Vcc(3)为1.5V时平均消耗电流为20nA,可在很低的静态电流下运行,即使在使用容量受限的纽扣电池的设备中,也能够实现长时间运行。 支持低电压驱动 "MRMS166R"可从1.2V开始工作,因此在电源条件受限的设备中也能够稳定运行。 小型封装 采用外形尺寸1.0×1.0mm的小型封装,可减少基板面积,便于搭载于小型设备。 (3) Vcc:指电源电压,是驱动AMR传感器运行所需的电压。 主要用途 医疗健康设备(胶囊内窥镜、医疗贴片、CGM)、可...

-
Alumni Ventures Announces Strategic Partnerships in Japan, Marks Global Expansion with Japan Office
MANCHESTER, N.H. & TOKYO--(BUSINESS WIRE)--Alumni Ventures expands globally with Tokyo office and new Japan partnerships linking U.S. and Japanese startup ecosystems....
-
Alumni Ventures、日本で戦略的パートナーシップを発表、日本オフィス開設でグローバル展開の節目に
ニューハンプシャー州マンチェスターおよび東京--(BUSINESS WIRE)--(ビジネスワイヤ) -- Alumni Venturesは、TIME誌の「米国トップ20ベンチャー・キャピタル企業」に選出されており、日本を代表する通信会社の1社であるKDDI、およびイノベーション推進に注力する日本有数の国立大学である東京大学の子会社、東京大学協創プラットフォーム開発株式会社(東大IPC)との日本における戦略的パートナーシップの形成を発表しました。これは、日本と米国のスタートアップの国境を越えた成長を加速させることを目的としています。今回の提携関係の開始は、2つのベンチャー・キャピタル・エコシステムの架け橋となるよう設計された先進的な戦略であり、革新的な技術とサービスを通じてスタートアップがグローバル規模で協業することを後押しします。 Alumni Venturesはまた、東京・六本木地区のトライセブン六本木内にAlumni Ventures Japan株式会社の拠点を設けたことも発表しました。これは、Alumni Venturesのアジア太平洋地域での成長戦略における重要な節目となる...
-
ソウル・バイオシス、光半導体で600億ドル規模のAIデータセンター向け光通信市場を狙う
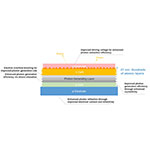
韓国、ソウル--(BUSINESS WIRE)--(ビジネスワイヤ) -- 光半導体デバイスを専門とするソウル・バイオシス(KOSDAQ: 092190)は、独自の「No-wire(無配線)」および「No-package(無パッケージ)」の基盤特許と、VCSEL技術における競争力を背景に、次世代フォトニクス市場への参入を加速しています。これらの特許は、光半導体のマイクロメートル(μm)スケールでの微細化を実現するための中核技術です。 AIの急速な普及により、データセンターは従来の銅ベースから光ベースのアーキテクチャへとパラダイムシフトが進んでいます。こうした中、同社は5年前に短距離通信用VCSEL企業を買収し、100G(25G×4)クラスの技術開発を完了することで競争力を強化しました。さらに、単なる部品供給にとどまらず、データインターコネクト向けのトータルトランシーバーソリューションプロバイダーへと事業モデルを拡張しています。 現在、同社はデータインターコネクト(光通信)分野における世界的リーダー2社と、技術共同開発や合弁事業、OEM生産の可能性について協議を進めています。加えて、米...
-
Sun Pharma signs Definitive Agreement to Acquire Organon
MUMBAI, India & JERSEY CITY, N.J.--(BUSINESS WIRE)--Sun Pharmaceutical Industries Limited (Reuters: SUN.BO, Bloomberg: SUNP IN, NSE: SUNPHARMA, BSE: 524715) (together with its subsidiaries and/or associated companies, “Sun Pharma”) and Organon & Co. (NYSE: OGN) (“Organon”) today announced that they have entered into a definitive agreement under which Sun Pharma will acquire all outstanding shares of Organon for US$ 14.00 per share in an all‑cash transaction with an enterprise valuation of U...