
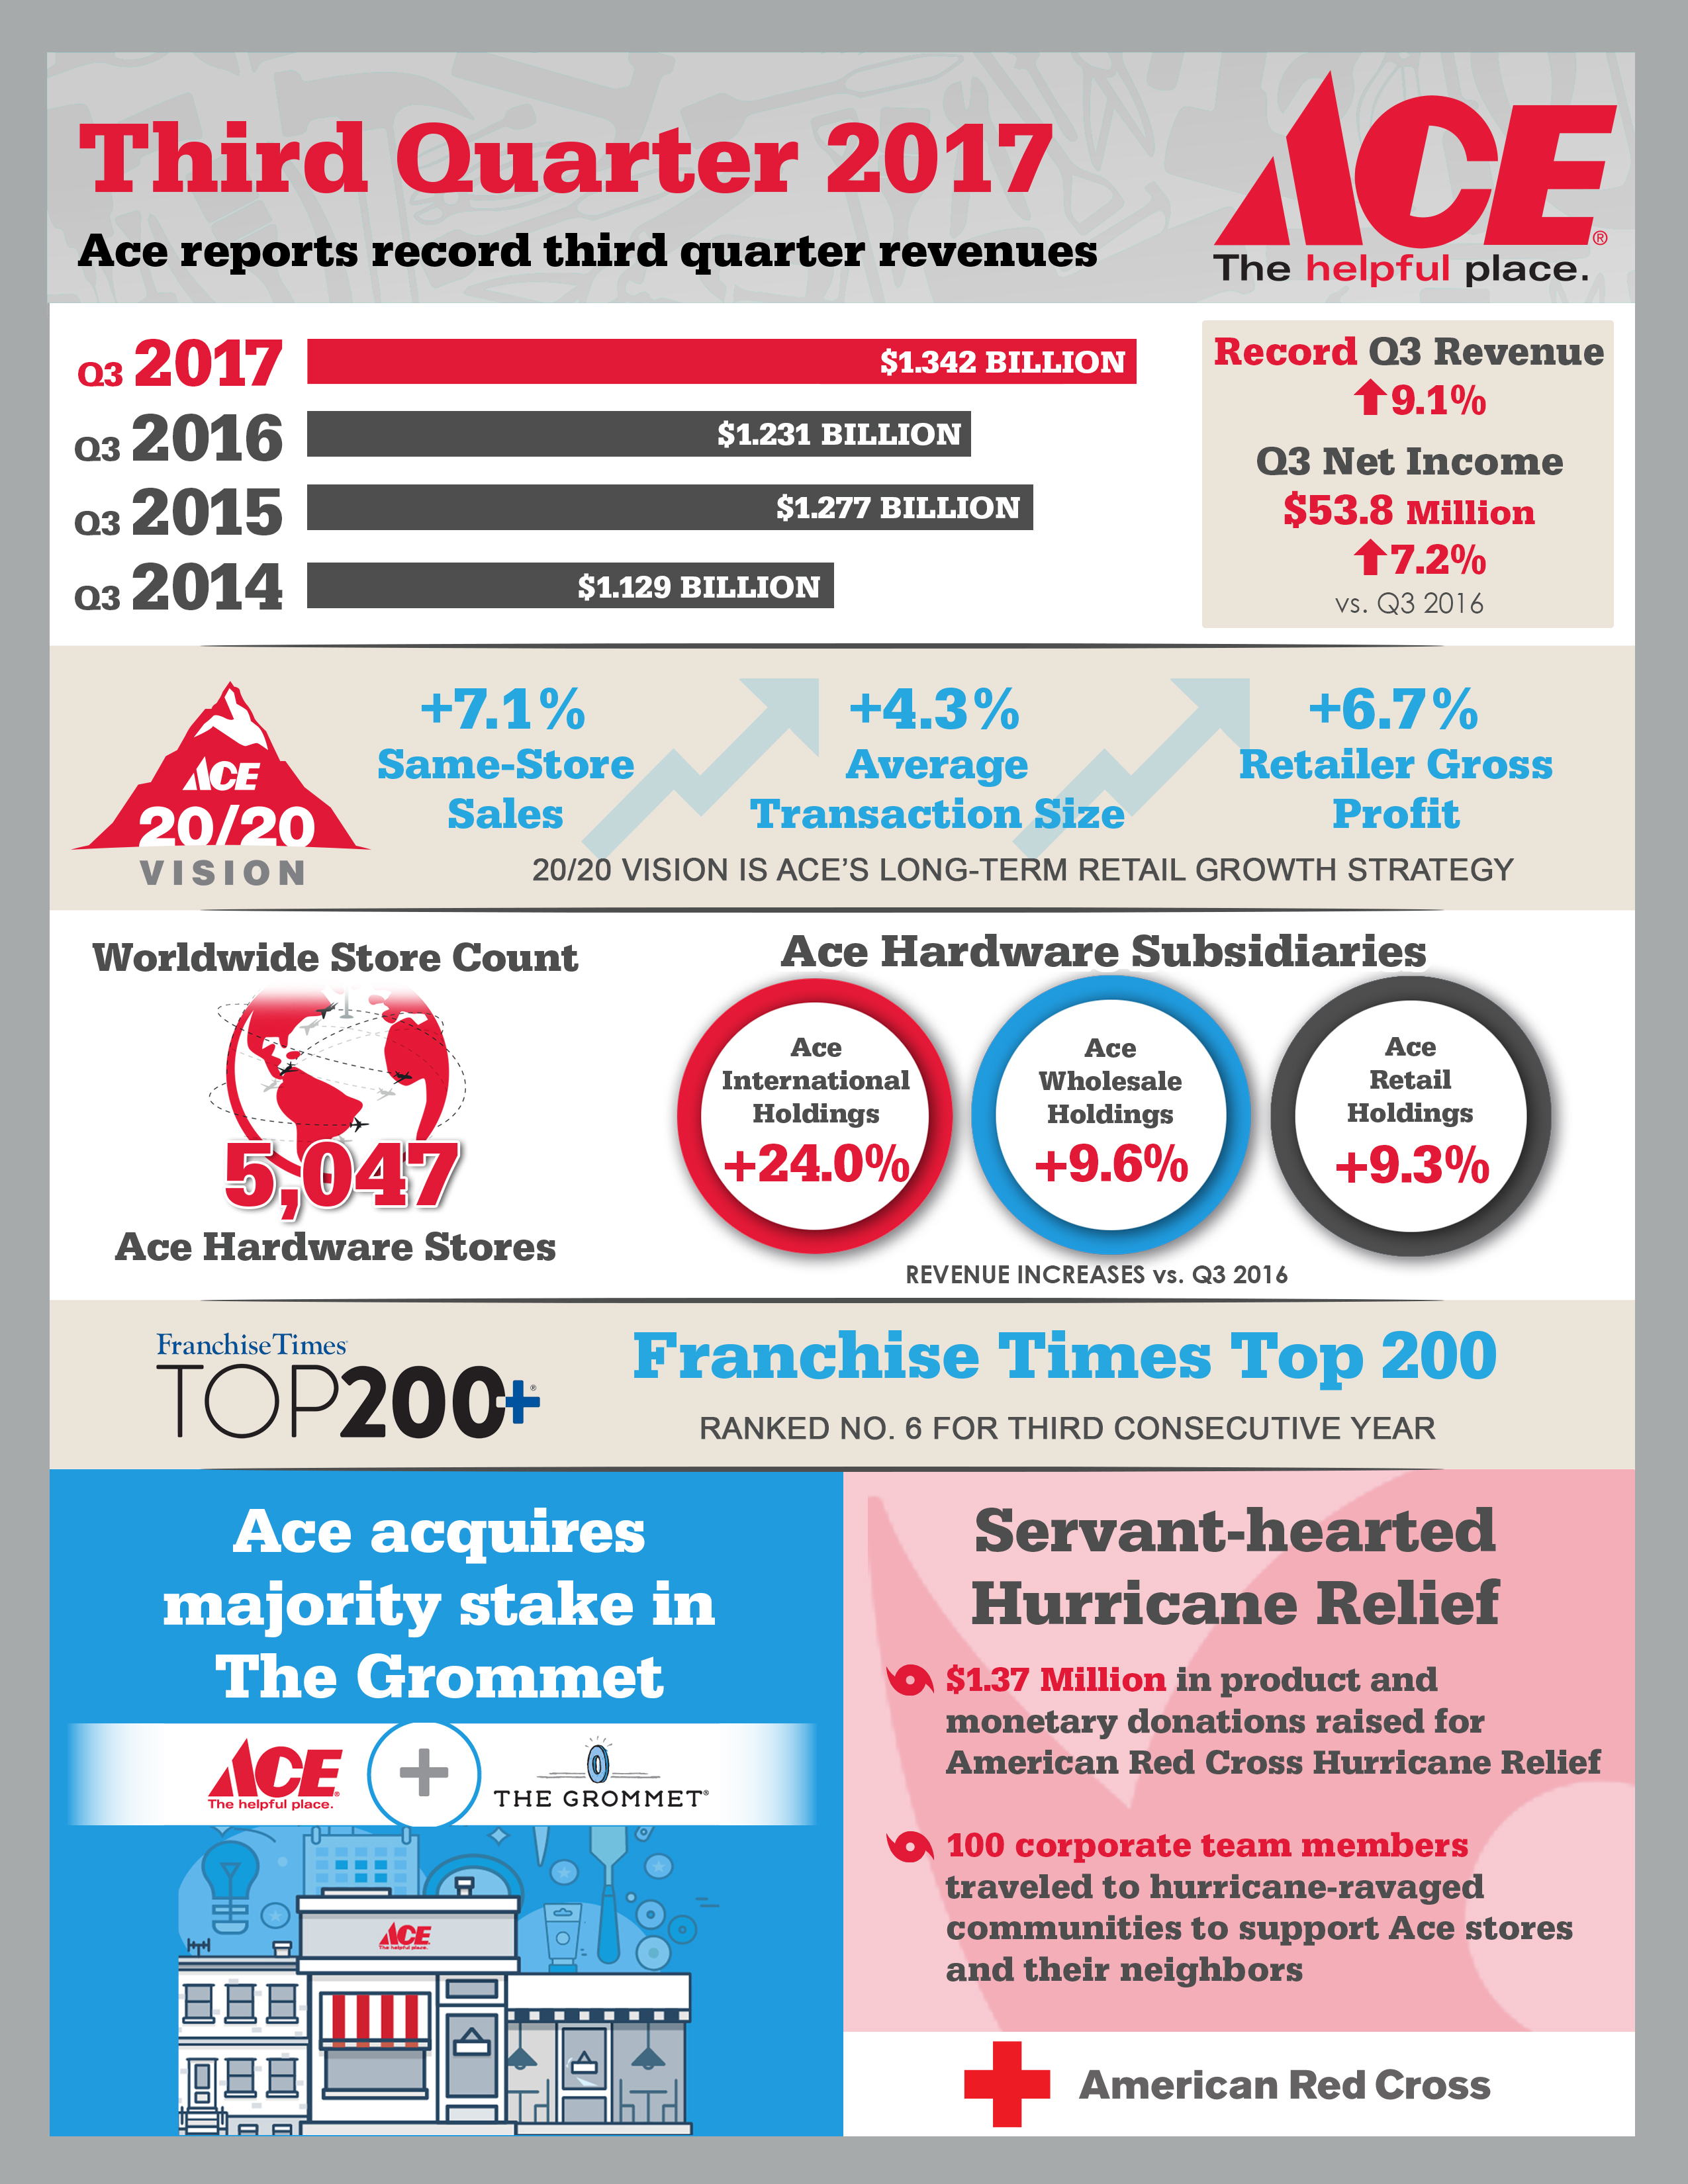
OAK BROOK, Ill.--(BUSINESS WIRE)--Ace Hardware Corporation (“Ace” or the “Company”), the largest retailer-owned hardware cooperative in the world, today reported third quarter 2017 revenues of $1.34 billion, an increase of $111.5 million, or 9.1 percent, from the third quarter of 2016. Net income was $53.8 million for the third quarter of 2017, an increase of $3.6 million from the third quarter of 2016.
During the third quarter of 2017, the Company acquired a majority stake in The Daily Grommet Inc., an e-commerce startup that markets and sells new and innovative products created by independent entrepreneurs.
“A retail same-store sales increase of 7.l percent was the predominant fuel behind our strong 9.1 percent overall sales increase and record setting third quarter revenue,” said John Venhuizen, President and CEO. “My sincere thanks to the Ace team for an aggressive and effective marketing plan coupled with exceptional execution at retail.”
“It would be an act of ingratitude not to give special thanks to the Ace team and our heroic retailers in the hurricane impacted areas of the world,” said Venhuizen. “While the hurricane activity accounted for only 18 percent of our third quarter revenue growth, it demonstrated a massive amount of servant-hearted teamwork across the enterprise and continues to garner our prayers and support as many difficult days remain for these regions.”
The 7.1 percent increase in retail same-store-sales during the third quarter of 2017 reported by the approximately 3,000 Ace retailers who share daily retail sales data was the result of a 4.3 percent increase in average ticket and a 2.7 percent increase in same-store transactions.
Revenues
Consolidated revenues for the quarter ended September 30, 2017 totaled $1.34 billion. Total wholesale revenues were $1.28 billion, an increase of $105.9 million, or 9.0 percent, as compared to the prior year third quarter. Increases were noted across all departments with outdoor living and lawn and garden showing the largest gains. Wholesale merchandise revenues to new domestic stores activated from January 2016 through September 2017 contributed $22.5 million of incremental revenues during the third quarter of 2017, while wholesale merchandise revenues decreased $8.9 million due to domestic stores that cancelled their membership. Wholesale merchandise revenues to comparable domestic stores increased $65.5 million for the quarter. The Company’s Ace Hardware International Holdings, Ltd. (“AIH”) subsidiary and Ace Wholesale Holdings LLC (“AWH”) subsidiary collectively contributed $21.3 million of incremental revenue in the third quarter of 2017.
Retail revenues from Ace Retail Holdings (“ARH”) were $65.5 million in the third quarter of 2017. This was an increase of $5.6 million, or 9.3 percent, from the third quarter of 2016. The increase was primarily the result of new retail stores added since the third quarter of 2016 and a 2.9 percent increase in same-store sales.
Ace added 43 new domestic stores in the third quarter of 2017 and cancelled 34 stores. This brought the Company’s total domestic store count to 4,366 at the end of the third quarter of 2017, an increase of 31 stores from the third quarter of 2016. On a worldwide basis, Ace added 57 stores in the third quarter of 2017 and cancelled 34, bringing the worldwide store count to 5,047 at the end of the third quarter of 2017.
Gross Profit
Wholesale gross profit for the three months ended September 30, 2017 was $168.4 million, an increase of $13.2 million from the third quarter of 2016. The wholesale gross margin percentage was 13.2 percent of wholesale revenues in the third quarter of 2017, down slightly from the third quarter of 2016 gross margin percentage of 13.3 percent.
Retail gross profit for the three months ended September 30, 2017 was $28.8 million, an increase of $2.2 million from the third quarter of 2016. The retail gross margin percentage was 44.0 percent of retail revenues in the third quarter of 2017, a decrease from 44.4 percent in the third quarter of 2016. Retail gross profit is determined based on the Company’s wholesale acquisition cost of product, not ARH’s acquisition cost which includes a markup from the Company.
Expenses
Wholesale operating expenses increased $11.3 million, or 10.9 percent, for the third quarter of 2017 as compared to the third quarter of 2016. The increase was primarily due to higher payroll expenses from prior year changes to Company benefit policies and a higher incentive accrual in 2017. As a percentage of wholesale revenues, wholesale operating expenses increased slightly to 9.0 percent of wholesale revenues in the third quarter of 2017 from 8.9 percent of wholesale revenues in the third quarter of 2016.
Retail operating expenses of $27.8 million increased $2.5 million, or 9.9 percent, from the third quarter of 2016. The increase was primarily due to expenses from new retail stores added since the third quarter of 2016. Retail operating expenses increased to 42.4 percent of retail revenues in the third quarter of 2017 from 42.2 percent in the third quarter of 2016, primarily due to increases in payroll and benefits, rent expense, and store supplies expense.
The Company recorded a $0.5 million decrease in warehouse facility closure expenses in the third quarter of 2017 as a result of updated projections of post-employment benefits that will be paid in connection with the future closing of certain warehouse and distribution facilities.
Balance Sheet
Receivables increased $57.3 million from the third quarter of 2016 primarily as a result of higher trade receivables driven by an increase in warehouse and dropship sales.
Inventories increased $34.8 million from the third quarter of 2016 primarily due to higher seasonal inventories, a build up for hurricane relief, higher inventories at AWH to provide improved service levels, increased inventories at ARH from new store acquisitions, and inventory from the acquisition of The Daily Grommet Inc. The increase in inventory was more than offset by a $98.7 million increase in accounts payable due to higher inventory levels and the timing of payments.
Debt decreased $21.6 million versus the third quarter of 2016 primarily as a result of increased cash provided by operating activities, partially offset by acquisitions, purchases of property and equipment, and cash payments on patronage dividends.
About Ace Hardware
For more than 90 years, Ace Hardware has been known as the place with the helpful hardware folks in thousands of neighborhoods across America, providing customers with a more personal kind of helpful. In 2017, Ace ranked "Highest in Customer Satisfaction with Home Improvement Retail Stores, Eleven Years in a Row," according to J.D. Power. With more than 5,000 hardware stores locally owned and operated across the globe, Ace is the largest retailer-owned hardware cooperative in the world. Headquartered in Oak Brook, Ill., Ace and its subsidiaries operate an expansive network of distribution centers in the U.S. and also have distribution capabilities in Ningbo, China; Colon, Panama; and Dubai, United Arab Emirates. Its retailers' stores are located in all 50 states, the District of Columbia and approximately 55 countries. For more information on Ace, visit acehardware.com or the Company newsroom at newsroom.acehardware.com.
| ACE HARDWARE CORPORATION | ||||||||||||||||||||
| CONSOLIDATED STATEMENTS OF INCOME | ||||||||||||||||||||
| (Unaudited, in millions) | ||||||||||||||||||||
| Three Months Ended | Nine Months Ended | |||||||||||||||||||
| September 30, | October 1, | September 30, | October 1, | |||||||||||||||||
| 2017 | 2016 | 2017 | 2016 | |||||||||||||||||
| (13 Weeks) | (13 Weeks) | (39 Weeks) | (39 Weeks) | |||||||||||||||||
| Revenues: | ||||||||||||||||||||
| Wholesale revenues | $ | 1,276.9 | $ | 1,171.0 | $ | 3,865.0 | $ | 3,696.0 | ||||||||||||
| Retail revenues | 65.5 | 59.9 | 207.8 | 197.9 | ||||||||||||||||
| Total revenues | 1,342.4 | 1,230.9 | 4,072.8 | 3,893.9 | ||||||||||||||||
| Cost of revenues: | ||||||||||||||||||||
| Wholesale cost of revenues | 1,108.5 | 1,015.8 | 3,376.5 | 3,235.0 | ||||||||||||||||
| Retail cost of revenues | 36.7 | 33.3 | 114.5 | 109.0 | ||||||||||||||||
| Total cost of revenues | 1,145.2 | 1,049.1 | 3,491.0 | 3,344.0 | ||||||||||||||||
| Gross profit: | ||||||||||||||||||||
| Wholesale gross profit | 168.4 | 155.2 | 488.5 | 461.0 | ||||||||||||||||
| Retail gross profit | 28.8 | 26.6 | 93.3 | 88.9 | ||||||||||||||||
| Total gross profit | 197.2 | 181.8 | 581.8 | 549.9 | ||||||||||||||||
| Distribution operations expenses | 39.1 | 35.3 | 109.9 | 102.9 | ||||||||||||||||
| Selling, general and administrative expenses | 45.0 | 40.0 | 135.7 | 123.9 | ||||||||||||||||
| Retailer success and development expenses | 31.2 | 28.7 | 111.5 | 100.1 | ||||||||||||||||
| Retail operating expenses | 27.8 | 25.3 | 81.1 | 74.4 | ||||||||||||||||
| Warehouse facility closure costs | (0.5 | ) | 0.8 | 4.2 | 0.8 | |||||||||||||||
| Total operating expenses | 142.6 | 130.1 | 442.4 | 402.1 | ||||||||||||||||
| Operating income | 54.6 | 51.7 | 139.4 | 147.8 | ||||||||||||||||
| Interest expense | (3.6 | ) | (3.0 | ) | (10.9 | ) | (9.6 | ) | ||||||||||||
| Interest income | 1.5 | 0.8 | 3.2 | 2.5 | ||||||||||||||||
| Other income, net | 1.2 | 1.2 | 3.6 | 4.3 | ||||||||||||||||
| Income tax benefit (expense) | 0.1 | (0.5 | ) | (2.1 | ) | (5.3 | ) | |||||||||||||
| Net income | 53.8 | 50.2 | 133.2 | 139.7 | ||||||||||||||||
| Less: net income attributable to noncontrolling interests | 0.2 | - | 0.6 | 0.3 | ||||||||||||||||
| Net income attributable to Ace Hardware Corporation | $ | 53.6 | $ | 50.2 | $ | 132.6 | $ | 139.4 | ||||||||||||
| Patronage distributions accrued | $ | 56.1 | $ | 52.4 | $ | 137.3 | $ | 136.6 | ||||||||||||
| Patronage distributions accrued for third party retailers | $ | 54.8 | $ | 51.5 | $ | 133.7 | $ | 133.7 | ||||||||||||
| ACE HARDWARE CORPORATION | |||||||||||||
| CONSOLIDATED BALANCE SHEETS | |||||||||||||
| (In millions, except share data) | |||||||||||||
| September 30, | December 31, | October 1, | |||||||||||
| 2017 | 2016 | 2016 | |||||||||||
| Assets | (Unaudited) | (Audited) | (Unaudited) | ||||||||||
| Cash and cash equivalents | $ | 19.7 | $ | 16.8 | $ | 15.3 | |||||||
| Marketable securities | 50.1 | 49.1 | 49.7 | ||||||||||
| Receivables, net of allowance for doubtful accounts of $7.9, $6.9 and $7.3, respectively |
463.4 |
400.9 | 406.1 | ||||||||||
| Inventories | 816.4 | 740.8 | 781.6 | ||||||||||
| Prepaid expenses and other current assets | 45.1 | 42.4 | 42.0 | ||||||||||
| Total current assets | 1,394.7 | 1,250.0 | 1,294.7 | ||||||||||
| Property and equipment, net | 341.4 | 340.0 | 327.9 | ||||||||||
| Notes receivable, net of allowance for doubtful accounts of $5.3, $7.7 and $7.7, respectively |
10.4 |
9.4 | 15.3 | ||||||||||
| Goodwill and other intangible assets | 90.6 | 35.8 | 35.9 | ||||||||||
| Other assets | 87.7 | 93.5 | 98.3 | ||||||||||
| Total assets | $ | 1,924.8 | $ | 1,728.7 | $ | 1,772.1 | |||||||
| Liabilities and Equity | |||||||||||||
| Current maturities of long-term debt | $ | 50.1 | $ | 36.4 | $ | 33.1 | |||||||
| Accounts payable | 750.4 | 629.7 | 651.7 | ||||||||||
| Patronage distributions payable in cash | 54.6 | 62.2 | 54.9 | ||||||||||
| Patronage refund certificates payable | 6.9 | 6.9 | 8.5 | ||||||||||
| Accrued expenses | 158.5 | 157.6 | 140.6 | ||||||||||
| Total current liabilities | 1,020.5 | 892.8 | 888.8 | ||||||||||
| Long-term debt | 185.8 | 178.4 | 224.4 | ||||||||||
| Patronage refund certificates payable | 85.0 | 60.9 | 65.9 | ||||||||||
| Other long-term liabilities | 70.2 | 63.3 | 65.4 | ||||||||||
| Total liabilities | 1,361.5 | 1,195.4 | 1,244.5 | ||||||||||
| Member Retailers’ Equity: | |||||||||||||
| Class A voting common stock, $1,000 par value, 10,000 shares authorized, 2,712, 2,726 and 2,724 issued and outstanding, respectively | 2.7 | 2.7 | 2.7 | ||||||||||
| Class C nonvoting common stock, $100 par value, 6,000,000 shares authorized, 4,462,081, 4,132,170 and 4,158,871 issued and outstanding, respectively | 446.2 | 413.2 | 415.9 | ||||||||||
| Class C nonvoting common stock, $100 par value, issuable to retailers for patronage distributions, 450,968, 523,158 and 466,814 shares issuable, respectively | 45.1 | 52.3 | 46.6 | ||||||||||
| Contributed capital | 18.2 | 18.2 | 18.1 | ||||||||||
| Retained earnings | 36.0 | 37.2 | 34.8 | ||||||||||
| Accumulated other comprehensive income (loss) | 2.3 | 0.5 | (0.7 | ) | |||||||||
| Equity attributable to Ace member retailers | 550.5 | 524.1 | 517.4 | ||||||||||
| Equity attributable to noncontrolling interests | 12.8 | 9.2 | 10.2 | ||||||||||
| Total equity | 563.3 | 533.3 | 527.6 | ||||||||||
| Total liabilities and equity | $ | 1,924.8 | $ | 1,728.7 | $ | 1,772.1 | |||||||
| ACE HARDWARE CORPORATION | ||||||||||
| CONSOLIDATED STATEMENTS OF CASH FLOWS | ||||||||||
| (Unaudited, in millions) | ||||||||||
|
|
Nine Months Ended | |||||||||
| September 30, | October 1, | |||||||||
| 2017 | 2016 | |||||||||
| (39 Weeks) | (39 Weeks) | |||||||||
| Operating Activities | ||||||||||
| Net income | $ | 133.2 | $ | 139.7 | ||||||
| Adjustments to reconcile net income to net cash provided by operating activities: | ||||||||||
| Depreciation and amortization | 36.3 | 38.3 | ||||||||
| Amortization of deferred financing costs | 0.4 | 0.4 | ||||||||
| Gain on the disposal of assets, net | (0.5 | ) | (0.1 | ) | ||||||
| Bad debt income | (0.9 | ) | (1.3 | ) | ||||||
| Other, net | 0.3 | (0.1 | ) | |||||||
| Changes in operating assets and liabilities, exclusive of effects of acquisitions: | ||||||||||
| Receivables | (78.4 | ) | (52.5 | ) | ||||||
| Inventories | (65.2 | ) | (65.6 | ) | ||||||
| Other current assets | (2.3 | ) | 3.1 | |||||||
| Other long-term assets | 5.1 | - | ||||||||
| Accounts payable and accrued expenses | 109.9 | 69.5 | ||||||||
| Other long-term liabilities | 8.0 | 3.4 | ||||||||
| Net cash provided by operating activities | 145.9 | 134.8 | ||||||||
| Investing Activities | ||||||||||
| Purchases of marketable securities | (3.6 | ) | (4.1 | ) | ||||||
| Proceeds from sale of marketable securities | 5.0 | 3.3 | ||||||||
| Purchases of property and equipment | (37.6 | ) | (49.0 | ) | ||||||
| Cash paid for acquired businesses, net of cash acquired | (52.5 | ) | (3.0 | ) | ||||||
| (Increase) decrease in notes receivable, net | (5.1 | ) | 0.5 | |||||||
| Other, net | (1.0 | ) | - | |||||||
| Net cash used in investing activities | (94.8 | ) | (52.3 | ) | ||||||
| Financing Activities | ||||||||||
| Net borrowings (payments) under revolving lines of credit | 16.9 | (14.4 | ) | |||||||
| Principal payments on long-term debt | (6.0 | ) | (5.4 | ) | ||||||
| Payments of cash portion of patronage distribution | (58.7 | ) | (53.7 | ) | ||||||
| Payments of patronage refund certificates | - | (0.2 | ) | |||||||
| Repurchase of stock | (1.0 | ) | (1.3 | ) | ||||||
| Purchase of noncontrolling interests | (0.1 | ) | (4.4 | ) | ||||||
| Other, net | 0.7 | 0.9 | ||||||||
| Net cash used in financing activities | (48.2 | ) | (78.5 | ) | ||||||
| Increase in cash and cash equivalents | 2.9 | 4.0 | ||||||||
| Cash and cash equivalents at beginning of period | 16.8 | 11.3 | ||||||||
| Cash and cash equivalents at end of period | $ | 19.7 | $ | 15.3 | ||||||
| Supplemental disclosure of cash flow information: | ||||||||||
| Interest paid | $ | 8.8 | $ | 8.3 | ||||||
| Income taxes paid | $ | 1.3 | $ | 2.6 | ||||||