
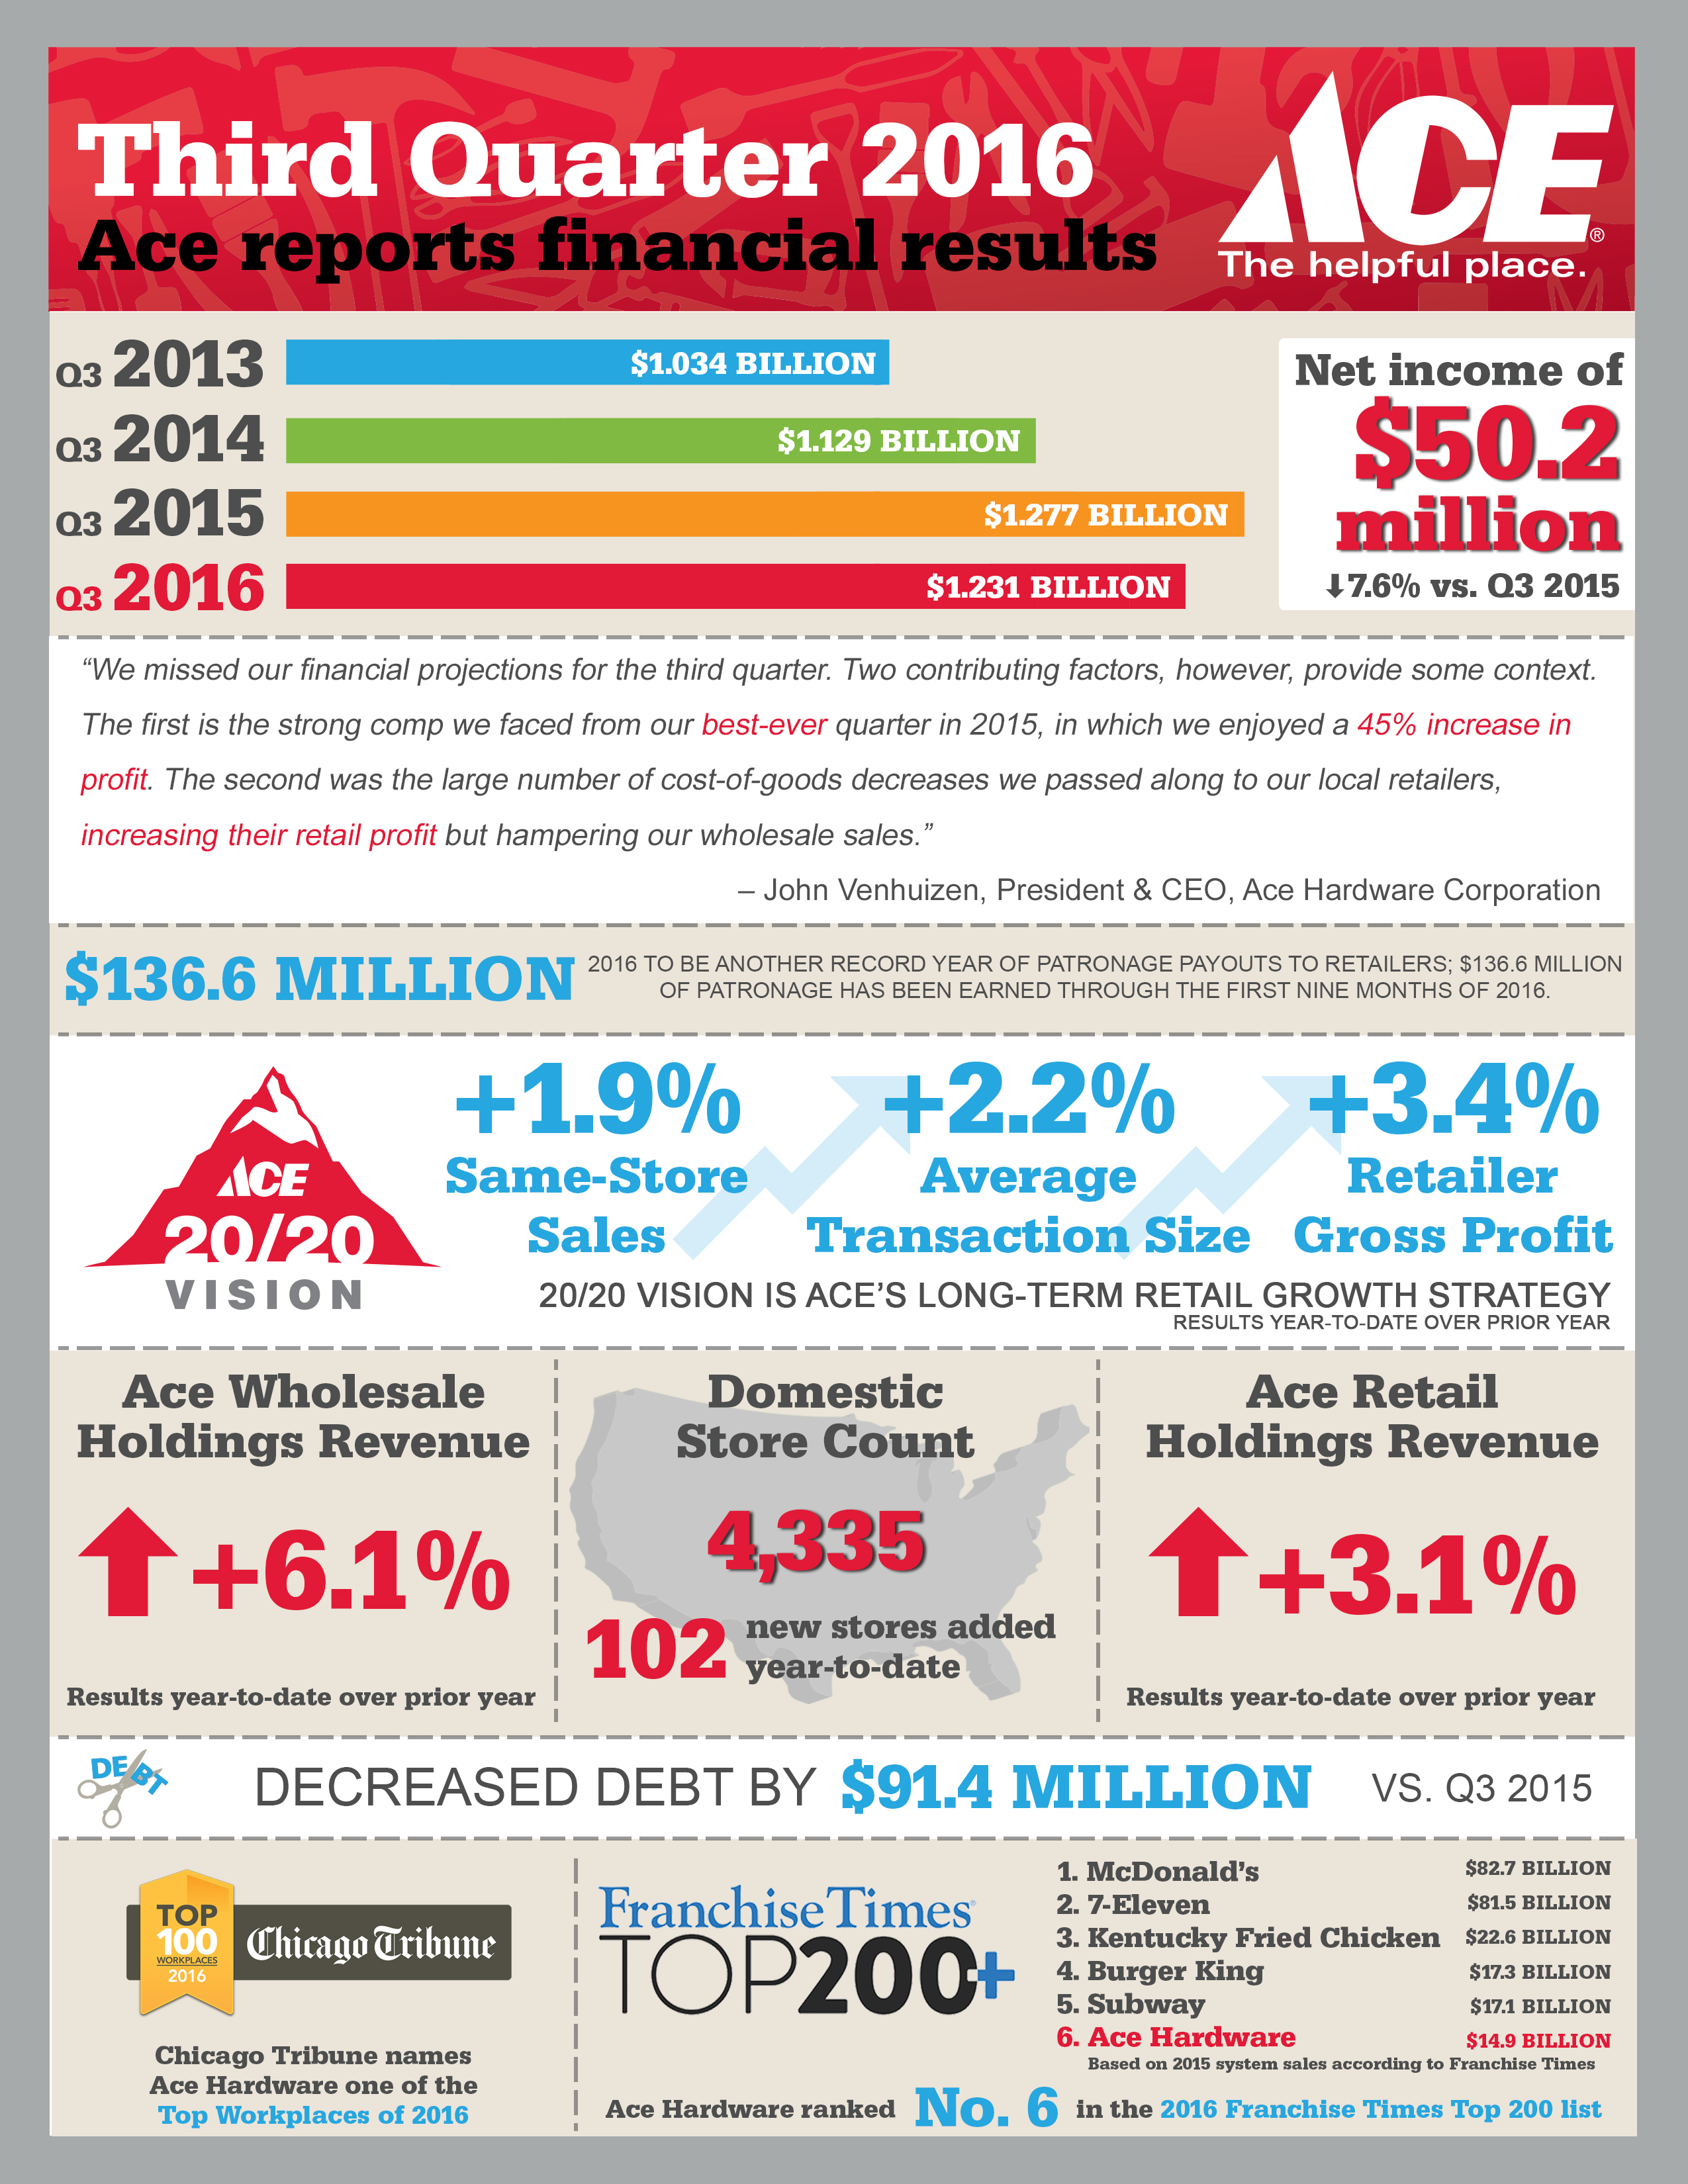
OAK BROOK, Ill.--(BUSINESS WIRE)--Ace Hardware Corporation (“Ace” or the “Company”), the largest retailer-owned hardware cooperative in the world, today reported third quarter 2016 revenues of $1.2 billion, a decrease of $46.5 million or 3.6 percent from the third quarter of 2015. Net income was $50.2 million for the third quarter of 2016, a decrease of $4.1 million from the third quarter of 2015.
“Our expectation for the third quarter of this year was modest sales growth and lower net income as a result of last year’s strong 13.2 percent consolidated revenue growth and 45.3 percent net income growth,” said John Venhuizen, President and CEO. “We missed on sales in our Ace domestic business, but exceeded our net income budget. The Ace domestic sales shortfall was largely driven by last year’s sell-in of LED lights and the lowering of wholesale selling prices to our retailers. For our shareholders, these wholesale price reductions were positive as over three-quarters of our wholesale price changes were decreases, resulting in less margin for the corporation, but more margin for our retailers.”
The 0.8 percent increase in retail same-store-sales during the third quarter reported by the approximately 3,000 Ace retailers who share daily retail sales data was the result of a 2.2 percent increase in average transaction size. For the first nine months of 2016, retail same-store-sales are up 1.9 percent.
Revenues
Consolidated revenues for the quarter ended October 1, 2016 totaled $1.2 billion. Total wholesale revenues were $1.17 billion, a decrease of $46.2 million, or 3.8 percent, as compared to the prior year third quarter. Decreases were noted across several departments with electrical, paint and plumbing showing the largest declines.
Wholesale merchandise revenues to new domestic stores activated from January 2015 through September 2016 contributed $20.4 million in incremental revenues during the quarter, while wholesale merchandise revenues decreased $11.6 million due to stores that cancelled their membership. Wholesale merchandise revenues to comparable stores decreased $39.1 million in the third quarter of 2016. A significant portion of that decline was the result of significant sales of LED bulbs in the third quarter of last year as part of store resets and to support an October 2015 LED promotion. The Company’s Ace Wholesale Holdings LLC (“AWH”) subsidiary contributed $1.9 million of incremental revenue in the third quarter of 2016, which was an increase of 2.1 percent from the prior year third quarter.
Retail revenues from Ace Retail Holdings (“ARH”) were $ 59.9 million in the third quarter of 2016. This was a decrease of $0.3 million, or 0.5 percent, from the third quarter of 2015. Same-store-sales decreased 3.4 percent compared to the prior year with the largest decreases in paint, lawn and garden and hardware.
Ace added 36 new domestic stores in the third quarter of 2016 and cancelled 16 stores. This brought the Company’s total domestic store count to 4,335 at the end of the third quarter of 2016, an increase of 60 stores from the third quarter of 2015.
Gross Profit
Wholesale gross profit for the three months ended October 1, 2016 was $155.2 million, a decrease of $10.4 million from the third quarter of 2015. The wholesale gross margin percentage was 13.3 percent of wholesale revenues in the third quarter of 2016, a decrease from the unusually high 2015 third quarter gross margin percentage of 13.6 percent. The unusually high 2015 third quarter gross margin was driven by the timing of vendor funds.
Retail gross profit for the third quarter of 2016 was $26.6 million, a decrease of $0.4 million from the third quarter of 2015. The retail gross margin percentage was 44.4 percent of retail revenues in the third quarter of 2016, down from 44.9 percent in the prior year third quarter. The decrease in the retail gross margin percentage was primarily the result of product mix and higher clearance discounts. Retail gross profit is determined based on the Company’s wholesale acquisition cost of product, not ARH’s acquisition cost which includes a markup from the Company.
Expenses
Wholesale operating expenses decreased $5.5 million, or 5.0 percent, for the third quarter of 2016 as compared to the third quarter of 2015. The decrease was primarily due to favorability in compensation and benefits expenses as well as favorable bad debt adjustments. As a percentage of wholesale revenues, wholesale operating expenses decreased from 9.0 percent of wholesale revenues in the third quarter of 2015 to 8.9 percent of wholesale revenues in the third quarter of 2016.
Retail operating expenses of $25.3 million increased $1.1 million, or 4.5 percent, in the third quarter of 2016 as compared to the third quarter of 2015. The increase was primarily driven by higher expenses from new retail stores added in the second and third quarters of 2016 which added $0.8 million of expense. Retail operating expenses as a percentage of retail revenues increased to 42.2 percent of retail revenues in the third quarter of 2016 from 40.2 percent in third quarter of 2015 due to the 3.4 percent same-store-sales decline. During the third quarters of 2016 and 2015, ARH recorded charges of $0.8 million and $ 2.0 million, respectively, related to the closure of its leased distribution center in Lenexa, Kansas.
Balance Sheet
Receivables decreased $24.7 million from the third quarter of 2015 as a result of lower sales and seasonal dating programs on trade receivables.
Inventories decreased $31.8 million from the third quarter of 2015 primarily due to a planned decrease in LED lighting and power tools merchandise.
Debt decreased $91.4 million versus the third quarter of 2015 as a result of cash provided by the Company’s operating activities during the past twelve months.
About Ace Hardware
For more than 90 years, Ace Hardware has been known as the place with the helpful hardware folks in thousands of neighborhoods across America, providing customers with a more personal kind of helpful. In 2016, Ace ranked “Highest in Customer Satisfaction with Home Improvement Retail Stores, Ten years in a Row,” according to J.D. Power. With more than 4,900 hardware stores locally owned and operated across the globe, Ace is the largest retailer-owned hardware cooperative in the world. Headquartered in Oak Brook, Ill., Ace and its subsidiaries currently operate 17 distribution centers in the U.S. and also have distribution capabilities in Ningbo, China; Colon, Panama; and Dubai, United Arab Emirates. Its retailers' stores are located in all 50 states, the District of Columbia and approximately 60 countries. For more information on Ace, visit www.acehardware.com.
| ACE HARDWARE CORPORATION | ||||||||||||||||||
|
CONSOLIDATED STATEMENTS OF INCOME |
||||||||||||||||||
|
(Unaudited, in millions) |
||||||||||||||||||
| Three Months Ended | Nine Months Ended | |||||||||||||||||
| October 1, | October 3, | October 1, | October 3, | |||||||||||||||
| 2016 | 2015 | 2016 | 2015 | |||||||||||||||
| (13 Weeks) | (13 Weeks) | (39 Weeks) | (39 Weeks) | |||||||||||||||
| Revenues: | ||||||||||||||||||
| Wholesale revenues | $ | 1,171.0 | $ | 1,217.2 | $ | 3,696.0 | $ | 3,689.1 | ||||||||||
| Retail revenues | 59.9 | 60.2 | 197.9 | 191.9 | ||||||||||||||
| Total revenues | 1,230.9 | 1,277.4 | 3,893.9 | 3,881.0 | ||||||||||||||
| Cost of revenues: | ||||||||||||||||||
| Wholesale cost of revenues | 1,015.8 | 1,051.6 | 3,235.0 | 3,221.9 | ||||||||||||||
| Retail cost of revenues | 33.3 | 33.2 | 109.0 | 105.5 | ||||||||||||||
| Total cost of revenues | 1,049.1 | 1,084.8 | 3,344.0 | 3,327.4 | ||||||||||||||
| Gross profit: | ||||||||||||||||||
| Wholesale gross profit | 155.2 | 165.6 | 461.0 | 467.2 | ||||||||||||||
| Retail gross profit | 26.6 | 27.0 | 88.9 | 86.4 | ||||||||||||||
| Total gross profit | 181.8 | 192.6 | 549.9 | 553.6 | ||||||||||||||
| Distribution operations expenses | 35.3 | 33.6 | 102.9 | 98.1 | ||||||||||||||
| Selling, general and administrative expenses | 40.0 | 44.3 | 123.9 | 120.6 | ||||||||||||||
| Retailer success and development expenses | 28.7 | 31.6 | 100.1 | 101.3 | ||||||||||||||
| Retail operating expenses | 25.3 | 24.2 | 74.4 | 71.9 | ||||||||||||||
| Warehouse facility closure costs | 0.8 | 2.0 | 0.8 | 3.7 | ||||||||||||||
| Total operating expenses | 130.1 | 135.7 | 402.1 | 395.6 | ||||||||||||||
| Operating income | 51.7 | 56.9 | 147.8 | 158.0 | ||||||||||||||
| Interest expense | (3.0 | ) | (3.3 | ) | (9.6 | ) | (12.6 | ) | ||||||||||
| Interest income | 0.8 | 0.7 | 2.5 | 2.4 | ||||||||||||||
| Other income, net | 1.2 | 1.5 | 4.3 | 5.3 | ||||||||||||||
| Income tax expense | (0.5 | ) | (1.5 | ) | (5.3 | ) | (9.0 | ) | ||||||||||
| Net income | 50.2 | 54.3 | 139.7 | 144.1 | ||||||||||||||
| Less: net income attributable to noncontrolling interests | - | 0.1 | 0.3 | 2.5 | ||||||||||||||
| Net income attributable to Ace Hardware Corporation | $ | 50.2 | $ | 54.2 | $ | 139.4 | $ | 141.6 | ||||||||||
| Patronage distributions accrued | $ | 52.4 | $ | 54.3 | $ | 136.6 | $ | 132.7 | ||||||||||
| Patronage distributions accrued for third party retailers | $ | 51.5 | $ | 53.4 | $ | 133.7 | $ | 130.2 | ||||||||||
| ACE HARDWARE CORPORATION | |||||||||||
|
CONSOLIDATED BALANCE SHEETS |
|||||||||||
|
(In millions, except share data) |
|||||||||||
| October 1, | January 2, | October 3, | |||||||||
| Assets | 2016 | 2016 | 2015 | ||||||||
| (Unaudited) | (Audited) | (Unaudited) | |||||||||
| Cash and cash equivalents | $ | 15.3 | $ | 11.3 | $ | 14.1 | |||||
| Marketable securities | 49.7 | 47.1 | 43.3 | ||||||||
|
Receivables, net of allowance for doubtful accounts of $7.3, $8.3 and $9.0, respectively |
406.1 | 375.3 | 430.8 | ||||||||
| Inventories | 781.6 | 714.5 | 813.4 | ||||||||
| Prepaid expenses and other current assets | 42.0 | 45.1 | 45.9 | ||||||||
| Total current assets | 1,294.7 | 1,193.3 | 1,347.5 | ||||||||
| Property and equipment, net | 327.9 | 318.1 | 312.6 | ||||||||
|
Notes receivable, net of allowance for doubtful accounts of $7.7, $8.7 and $9.3, respectively |
15.3 | 11.8 | 14.7 | ||||||||
| Goodwill and other intangible assets | 35.9 | 35.3 | 35.5 | ||||||||
| Other assets | 98.3 | 98.7 | 103.2 | ||||||||
| Total assets | $ | 1,772.1 | $ | 1,657.2 | $ | 1,813.5 | |||||
| Liabilities and Equity | |||||||||||
| Current maturities of long-term debt | $ | 33.1 | $ | 27.2 | $ | 26.7 | |||||
| Accounts payable | 651.7 | 552.5 | 647.4 | ||||||||
| Patronage distributions payable in cash | 54.9 | 57.5 | 53.7 | ||||||||
| Patronage refund certificates payable | 8.5 | 8.6 | 6.6 | ||||||||
| Accrued expenses | 140.6 | 172.9 | 153.7 | ||||||||
| Total current liabilities | 888.8 | 818.7 | 888.1 | ||||||||
| Long-term debt | 224.4 | 242.2 | 322.2 | ||||||||
| Patronage refund certificates payable | 65.9 | 41.3 | 51.4 | ||||||||
| Other long-term liabilities | 65.4 | 58.9 | 60.3 | ||||||||
| Total liabilities | 1,244.5 | 1,161.1 | 1,322.0 | ||||||||
| Member Retailers’ Equity: | |||||||||||
|
Class A voting common stock, $1,000 par value, 10,000 shares authorized, 2,724; 2,734 and 2,735 issued and outstanding, respectively |
2.7 | 2.7 | 2.7 | ||||||||
|
Class C nonvoting common stock, $100 par value, 6,000,000 shares authorized, 4,158,871; 3,756,627 and 3,813,087 issued and outstanding, respectively |
415.9 | 375.7 | 381.3 | ||||||||
|
Class C nonvoting common stock, $100 par value, issuable to retailers for patronage distributions, 466,814; 564,155 and 489,794 shares issuable, respectively |
46.6 | 56.4 | 49.0 | ||||||||
| Contributed capital | 18.1 | 20.7 | 20.7 | ||||||||
| Retained earnings | 34.8 | 28.4 | 26.9 | ||||||||
| Accumulated other comprehensive (loss) income | (0.7 | ) | 0.2 | (1.6 | ) | ||||||
| Equity attributable to Ace member retailers | 517.4 | 484.1 | 479.0 | ||||||||
| Equity attributable to noncontrolling interests | 10.2 | 12.0 | 12.5 | ||||||||
| Total equity | 527.6 | 496.1 | 491.5 | ||||||||
| Total liabilities and equity | $ | 1,772.1 | $ | 1,657.2 | $ | 1,813.5 | |||||
| ACE HARDWARE CORPORATION | |||||||||
|
CONSOLIDATED STATEMENTS OF CASH FLOWS |
|||||||||
|
(Unaudited, in millions) |
|||||||||
|
Nine Months Ended |
|||||||||
| October 1, | October 3, | ||||||||
| 2016 | 2015 | ||||||||
| Operating Activities | (39 Weeks) | (39 Weeks) | |||||||
| Net income | $ | 139.7 |
|
$ |
144.1 | ||||
| Adjustments to reconcile net income to net cash provided by operating activities: | 37.9 | ||||||||
| Depreciation and amortization | 38.3 | ||||||||
| Amortization of deferred financing costs | 0.4 | 0.6 | |||||||
| Loss on early extinguishment of debt | - | 2.2 | |||||||
| (Gain) loss on the disposal of assets, net | (0.1 | ) | 0.1 | ||||||
| (Credit) provision for doubtful accounts | (1.3 | ) | 1.1 | ||||||
| Other, net | (0.1 | ) | (0.1 | ) | |||||
| Changes in operating assets and liabilities, exclusive of effect of acquisitions: | (73.7 | ) | |||||||
| Receivables | (52.5 | ) | |||||||
| Inventories | (65.6 | ) | (116.8 | ) | |||||
| Other current assets | 3.1 | 1.2 | |||||||
| Other long-term assets | (0.1 | ) | (10.4 | ) | |||||
| Accounts payable and accrued expenses | 69.5 | 39.0 | |||||||
| Other long-term liabilities | 3.4 | (10.4 | ) | ||||||
| Deferred taxes | 0.1 | - | |||||||
| Net cash provided by operating activities | 134.8 | 14.8 | |||||||
| Investing Activities | (6.9 | ) | |||||||
| Purchases of marketable securities | (4.1 | ) | |||||||
| Proceeds from sale of marketable securities | 3.3 | 4.3 | |||||||
| Purchases of property and equipment | (49.0 | ) | (27.2 | ) | |||||
| Cash paid for acquired businesses, net of cash acquired | (3.0 | ) | (5.6 | ) | |||||
| Decrease in notes receivable, net | 0.5 | 1.6 | |||||||
| Other, net | - | 0.1 | |||||||
| Net cash used in investing activities | (52.3 | ) | (33.7 | ) | |||||
| Financing Activities | 231.2 | ||||||||
| Net (payments) borrowings under revolving lines of credit | (14.4 | ) | |||||||
| Principal payments on long-term debt | (5.4 | ) | (175.0 | ) | |||||
| Payments of deferred financing costs | - | (1.1 | ) | ||||||
| Payments of cash portion of patronage distribution | (53.7 | ) | (48.9 | ) | |||||
| Payments of patronage refund certificates | (0.2 | ) | (0.2 | ) | |||||
| Repurchase of stock | (1.3 | ) | (3.6 | ) | |||||
| Purchase of noncontrolling interests | (4.4 | ) | - | ||||||
| Other, net | 0.9 | 0.8 | |||||||
| Net cash (used in) provided by financing activities | (78.5 | ) | 3.2 | ||||||
| Increase (decrease) in cash and cash equivalents | 4.0 | (15.7 | ) | ||||||
| Cash and cash equivalents at beginning of period | 11.3 | 29.8 | |||||||
| Cash and cash equivalents at end of period | $ | 15.3 | $ | 14.1 | |||||
| Supplemental disclosure of cash flow information: | |||||||||
| Interest paid | $ | 8.3 |
|
$ |
8.6 | ||||
| Income taxes paid | $ | 2.6 | $ | 4.2 | |||||