
SANTA MONICA, Calif.--(BUSINESS WIRE)--TrueCar, Inc. (NASDAQ: TRUE) projects total new vehicle sales, including fleet deliveries, will reach 1,699,600 units in December, a 12.8 percent increase from a year ago and the highest ever for the month.
The likely growth this month will push total annual light vehicle sales to a record 17.5 million units, up 6.1 percent from a year ago. Continued consumer demand, favorable economic conditions and widespread year-end and holiday promotions should lift retail sales 14.2 percent to 1,458,400 units. Looking ahead to 2016, sales of new vehicles should continue to climb.
“This year marks a true milestone for an industry that vigorously rebounded from a recession-led collapse in 2009,” said Eric Lyman, TrueCar’s vice president of industry insights. “Consumers continue to re-enter the market in a big way, and we expect 2016 to be even stronger with new vehicle sales topping 18 million units.”
Strong U.S. economic fundamentals that benefitted the industry this year remain in place. Gas prices have stayed notably low, and that should continue in the months ahead; unemployment is projected to hover near 2015’s eight-year low; and GDP remains healthy. Additionally, and despite the recent 0.25-point increase, the federal fund rate remains below historical standards.
“We expect a negligible impact on auto sales from last week’s increase as the rate is still quite low amid an expanding economy,” said Oliver Strauss, TrueCar’s chief economist. “Even if we end 2016 with a rate of 1 percent, we think 18 million sales is attainable. Based on our analysis, interest rates would have to reach 3 percent next year before we see an inflection point that causes the year-over-year growth rate to stagnate.”
Kia may lead the charge in sales gains with a 29 percent rise in volume over a year ago, resulting in the brand’s best December. FCA should follow with a 19.8 percent sales increase, the industry’s second-highest percentage gain. Nissan may take third place, likely up 17.9 percent.
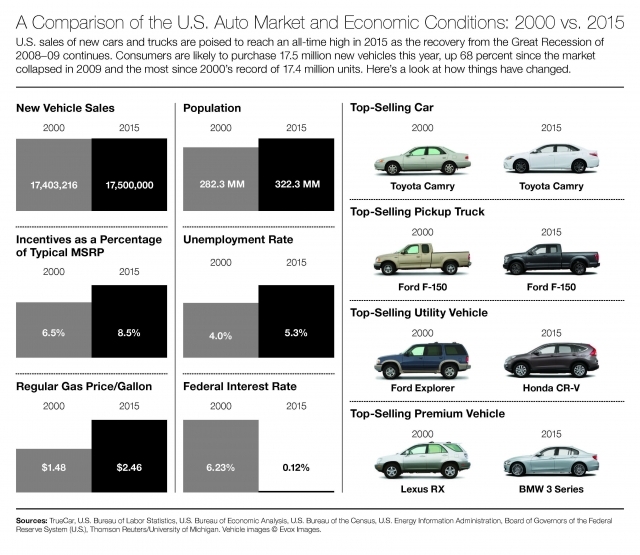
Sales of mass-market small utility vehicles, including both subcompact and compact models, are up 419 percent in 2015 versus 2000, the U.S. auto market’s previous volume peak.
“This is truly the year of the small crossover, signaling a big shift in consumer preference away from sedans over the past 15 years,” said Stacey Doyle, TrueCar’s senior industry analyst. “Small utilities now sell at five times the rate they did in 2000. At that time the top-selling utility was the Ford Explorer, mid-sized and built on a truck platform; this year it’s Honda’s compact CR-V. Consumers prefer smaller, car-based utilities due to their excellent fuel economy, ride quality and overall practicality.”
Incentive spending by automakers averaged $3,063 per vehicle in December, up 3.9 percent from a year ago and down 0.4 percent from November 2015.
Other key findings for December:
- Expected registration mix of 85.8 percent retail sales and 14.2 percent fleet versus 84.7 percent retail and 15.3 percent fleet last December.
- Total used auto sales, including franchise and independent dealerships and private-party transactions, may exceed 2,418,154, down 9.2 percent compared to December 2014.
Forecasts for the 12 largest manufacturers by volume:
Total Unit Sales
| Manufacturer | Dec 2015 Forecast | % Change vs. Dec 2014 |
% Change vs. Dec 2014 (Daily Selling Rate) |
||||||
| BMW | 52,400 | 8.7% | 0.9% | ||||||
| Daimler | 44,500 | 16.3% | 8.0% | ||||||
| FCA | 233,300 | 19.8% | 11.3% | ||||||
| Ford | 239,300 | 9.1% | 1.3% | ||||||
| GM | 307,700 | 12.1% | 4.1% | ||||||
| Honda | 151,700 | 10.5% | 2.6% | ||||||
| Hyundai | 73,400 | 13.8% | 5.7% | ||||||
| Kia | 58,800 | 29.0% | 19.8% | ||||||
| Nissan | 138,300 | 17.9% | 9.5% | ||||||
| Subaru | 52,000 | 4.2% | -3.3% | ||||||
| Toyota | 239,400 | 11.3% | 3.4% | ||||||
| Volkswagen Group | 52,200 | -8.6% | -15.1% | ||||||
|
Industry |
1,699,600 |
12.8% | 4.7% | ||||||
Total Market Share
| Manufacturer | December 2015 Forecast | December 2014 | November 2015 | ||||||
| BMW | 3.1% | 3.2% | 2.8% | ||||||
| Daimler | 2.6% | 2.5% | 2.5% | ||||||
| FCA | 13.7% | 12.9% | 13.4% | ||||||
| Ford | 14.1% | 14.6% | 14.2% | ||||||
| GM | 18.1% | 18.2% | 17.4% | ||||||
| Honda | 8.9% | 9.1% | 8.8% | ||||||
| Hyundai | 4.3% | 4.3% | 4.5% | ||||||
| Kia | 3.5% | 3.0% | 3.5% | ||||||
| Nissan | 8.1% | 7.8% | 8.1% | ||||||
| Subaru | 3.1% | 3.3% | 3.5% | ||||||
| Toyota | 14.1% | 14.3% | 14.4% | ||||||
| Volkswagen Group | 3.1% | 3.8% | 3.4% | ||||||
Retail Unit Sales
|
Manufacturer |
December 2015 Forecast |
% Change vs. December 2014 |
% Change vs. December 2014 (Daily Selling Rate) |
||||||
| BMW | 50,100 | 8.5% | 0.7% | ||||||
| Daimler | 42,500 | 16.5% | 8.2% | ||||||
| FCA | 174,100 | 18.7% | 10.2% | ||||||
| Ford | 182,300 | 14.2% | 6.1% | ||||||
| GM | 252,000 | 12.8% | 4.7% | ||||||
| Honda | 150,300 | 10.5% | 2.6% | ||||||
| Hyundai | 56,100 | 19.9% | 11.3% | ||||||
| Kia | 51,200 | 32.1% | 22.6% | ||||||
| Nissan | 120,700 | 13.3% | 5.2% | ||||||
| Subaru | 51,100 | 6.0% | -1.5% | ||||||
| Toyota | 228,900 | 16.9% | 8.6% | ||||||
| Volkswagen Group | 49,839 | 0.0% | -7.1% | ||||||
| Industry | 1,458,400 | 14.2% | 6.1% | ||||||
Incentive Spending
| Manufacturer | Incentive per Unit December 2015 Forecast | Incentive per Unit % Change vs. December 2014 | Incentive per Unit % Change vs. November 2015 | Total Spending December 2015 Forecast | ||||
| BMW | $5,019 | -12.4% | 0.1% | $262,490,316 | ||||
| Daimler | $4,712 | -17.2% | -3.3% | $209,673,426 | ||||
| FCA | $3,553 | 11.5% | 0.9% | $823,852,010 | ||||
| Ford | $3,162 | 2.2% | -2.3% | $756,780,860 | ||||
| GM | $3,710 | 5.7% | -2.7% | $1,141,630,444 | ||||
| Honda | $1,847 | -17.6% | 1.1% | $280,143,442 | ||||
| Hyundai | $2,163 | 24.9% | -1.0% | $158,727,666 | ||||
| Kia | $2,997 | 9.1% | 0.2% | $176,233,285 | ||||
| Nissan | $3,716 | 1.2% | -0.8% | $513,897,864 | ||||
| Subaru | $582 | -24.3% | 1.5% | $30,284,918 | ||||
| Toyota | $2,284 | 16.2% | -3.1% | $546,688,895 | ||||
| Volkswagen Group | $3,506 | 30.7% | -0.7% | $181,985,509 | ||||
| Industry | $3,063 | 3.9% | -0.4% | $5,194,396,546 |
(Note: This forecast is based solely on TrueCar’s analysis of industry sales trends and conditions and is not a projection of the company’s operations.)
About TrueCar
TrueCar, Inc. (NASDAQ: TRUE) gives consumers transparent insight into what others paid and access to guaranteed savings off MSRP from TrueCar Certified Dealers. TrueCar’s network of more than 10,000 trusted Certified Dealers is committed to providing upfront pricing information and a hassle-free buying experience. TrueCar powers car-buying programs for some of the largest U.S. membership and service organizations, including AARP, American Express, AAA, Sam’s Club and USAA. Not all program features are available in all states. TrueCar is headquartered in Santa Monica, California, with offices in San Francisco and Austin, Texas. For more information about TrueCar and industry analysis please visit www.truecar.com and insights.true.com. Follow us on Facebook or Twitter.
TrueCar media line: +1-844-469-8442 (US toll-free) | Email: pressinquiries@truecar.com