

Newsroom
Sorted by: Latest
-
First Trust Global Funds PLC UK Regulatory Announcement: Net Asset Value(s)
LONDON--(BUSINESS WIRE)-- Funds Date TIDM ISIN Code Shares in Issue Currency Net Asset Value NAV/per Share First Trust SMID Rising Dividend Achievers UCITS ETF 16.02.2026 SDVI.LN IE000YVOQ2A3 40,361.00 USD 1,156,738.27 28.660 ...
-
Best’s Special Report: U.S. Economy Grows Despite Emerging Headwinds
OLDWICK, N.J.--(BUSINESS WIRE)--The U.S. economy entered 2026 from a position of relative strength, continuing to outperform most advanced economies in 2025, a theme that is expected to persist in the coming year, according to a new AM Best report. According to the Best’s Special Report, “U.S. Economy Grows Despite Emerging Headwinds,” International Monetary Fund projections indicate that the country’s real gross domestic product growth will rise slightly to 2.4% in 2026, compared with 2.1% las...
-
SharkNinja Introduces Shark® SilkiPro™ Straight
NEEDHAM, Mass.--(BUSINESS WIRE)--SharkNinja Introduces Shark® SilkiPro™ Straight The Only Wet-to-Dry Straightener with RapidDry Technology and Integrated Combs...

-
First Trust Global Funds PLC UK Regulatory Announcement: Net Asset Value(s)
LONDON--(BUSINESS WIRE)-- Funds Date TIDM ISIN Code Shares in Issue Currency Net Asset Value NAV/per Share First Trust SMID Rising Dividend Achievers UCITS ETF 16.02.2026 SDVY.LN IE0001R850E1 12,204,007.00 USD 307,116,456.11 25.165 ...
-
First Trust Global Funds PLC UK Regulatory Announcement: Net Asset Value(s)
LONDON--(BUSINESS WIRE)-- Funds Date TIDM ISIN Code Shares in Issue Currency Net Asset Value NAV/per Share First Trust Growth Strength UCITS ETF 16.02.2026 FTGS.LN IE000YZLMXT9 25,002.00 USD 551,856.63 22.072 ...
-
First Trust Global Funds PLC UK Regulatory Announcement: Net Asset Value(s)
LONDON--(BUSINESS WIRE)-- Funds Date TIDM ISIN Code Shares in Issue Currency Net Asset Value NAV/per Share First Trust Vest U.S. Equity Moderate Buffer UCITS ETF - February 16.02.2026 GFEB.LN IE000X8M8M80 600,002.00 USD 22,473,826.43 37.456 ...
-
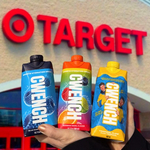
Cizzle Brands Corporation Announces U.S. Retail Expansion with Launch of CWENCH Hydration at 109 Target locations in the U.S.
TORONTO--(BUSINESS WIRE)--Cizzle Brands Corporation (Cboe Canada: CZZL) (OTCQB: CZZLF) (Frankfurt: 8YF) (the “Company”), the sports nutrition company elevating the game in health and wellness, is pleased to announce that its flagship sports hydration brand, CWENCH Hydration, has launched in 109 Target stores across the United States, as well as on Target.com. While CWENCH has been available at select U.S. retailers since May 2025—including Life Time Fitness and United Supermarkets—this launch m...
-
First Trust Global Funds PLC UK Regulatory Announcement: Net Asset Value(s)
LONDON--(BUSINESS WIRE)-- Funds Date TIDM ISIN Code Shares in Issue Currency Net Asset Value NAV/per Share First Trust Vest S&P 500 Dividend Aristocrats Target Income UCITS ETF 16.02.2026 KNG.LN IE000SNMGYT5 300,002.00 USD 6,536,438.74 21.788 ...
-
BostonGene Announces Strategic Collaboration with Daiichi Sankyo to Accelerate Drug Development Through AI-Driven Multimodal Analytics
WALTHAM, Mass.--(BUSINESS WIRE)--BostonGene, the developer of the leading AI foundation model for tumor and immune biology, today announced a strategic collaboration with Daiichi Sankyo (TSE: 4568). The collaboration will integrate AI-driven translational intelligence into the core of an antibody drug conjugate (ADC) development program of Daiichi Sankyo to move beyond standard exploratory biomarker analysis and deliver decision-ready insights that directly inform patient selection strategies,...
-
First Trust Global Funds PLC UK Regulatory Announcement: Net Asset Value(s)
LONDON--(BUSINESS WIRE)-- Funds Date TIDM ISIN Code Shares in Issue Currency Net Asset Value NAV/per Share First Trust Capital Strength UCITS ETF 16.02.2026 FTCS. IE00BL0L0D23 275,002.00 USD 9,331,764.11 33.933 ...