Newsroom
Sorted by: Latest
-
Citibank UK Regulatory Announcement: FRN Variable Rate Fix
LONDON--(BUSINESS WIRE)-- Re: VALLEY FUNDING PLC GBP .00 MATURING: 17-May-2066 ISIN: XS2959423984 PLEASE BE ADVISED THAT THE INTEREST RATE FOR THE PERIOD 17-Nov-2025 TO 16-Feb-2026 HAS BEEN FIXED AT 4.86 PCT DAY BASIS: ACTUAL/365(FIX) INTEREST PAYABLE VALUE 16-Feb-2026 WILL AMOUNT TO: GBP .00 PER GBP .00 DENOMINATION ...
-
Citibank UK Regulatory Announcement: FRN Variable Rate Fix
LONDON--(BUSINESS WIRE)-- Re: London Wall Mortgage Capital plc GBP 22,953,000.00 MATURING: 17-May-2055 ISIN: XS2830325234 PLEASE BE ADVISED THAT THE INTEREST RATE FOR THE PERIOD 17-Nov-2025 TO 16-Feb-2026 HAS BEEN FIXED AT 5.36 PCT DAY BASIS: ACTUAL/365(PROP) INTEREST PAYABLE VALUE 16-Feb-2026 WILL AMOUNT TO: GBP 251,689.86 PER GBP 18,844,973.76 DENOMINATION ...
-
Securities Fraud Investigation Into Kyndryl Holdings, Inc. (KD) Announced – Shareholders Who Lost Money Urged To Contact The Law Offices of Frank R. Cruz
LOS ANGELES--(BUSINESS WIRE)--The Law Offices of Frank R. Cruz announces an investigation of Kyndryl Holdings, Inc. (“Kyndryl” or the “Company”) (NYSE: KD) on behalf of investors concerning the Company’s possible violations of federal securities laws. IF YOU ARE AN INVESTOR WHO LOST MONEY ON KYNDRYL HOLDINGS, INC. (KD), CLICK HERE TO INQUIRE ABOUT POTENTIALLY PURSUING A CLAIM TO RECOVER YOUR LOSS. What Is The Investigation About? On February 9, 2026, Kyndryl announced the Company’s CFO and Gene...
-
Citibank UK Regulatory Announcement: FRN Variable Rate Fix
LONDON--(BUSINESS WIRE)-- Re: VALLEY FUNDING PLC GBP .00 MATURING: 17-May-2066 ISIN: XS2959460598 PLEASE BE ADVISED THAT THE INTEREST RATE FOR THE PERIOD 17-Nov-2025 TO 16-Feb-2026 HAS BEEN FIXED AT 9.36 PCT DAY BASIS: ACTUAL/365(FIX) INTEREST PAYABLE VALUE 16-Feb-2026 WILL AMOUNT TO: GBP .00 PER GBP .00 DENOMINATION ...
-
Citibank UK Regulatory Announcement: FRN Variable Rate Fix
LONDON--(BUSINESS WIRE)-- Re: London Wall Mortgage Capital plc GBP 10,064,000.00 MATURING: 17-May-2055 ISIN: XS2830326471 PLEASE BE ADVISED THAT THE INTEREST RATE FOR THE PERIOD 17-Nov-2025 TO 16-Feb-2026 HAS BEEN FIXED AT 6.36 PCT DAY BASIS: ACTUAL/365(PROP) INTEREST PAYABLE VALUE 16-Feb-2026 WILL AMOUNT TO: GBP 137,853.18 PER GBP 8,697,932.82 DENOMINATION ...
-
Citibank UK Regulatory Announcement: FRN Variable Rate Fix
LONDON--(BUSINESS WIRE)-- Re: WHITE ROSE MASTER ISSUER PLC GBP 350,000,000.00 MATURING: 17-Apr-2073 ISIN: XS2922764787 PLEASE BE ADVISED THAT THE INTEREST RATE FOR THE PERIOD 16-Jan-2026 TO 16-Feb-2026 HAS BEEN FIXED AT 4.25 PCT DAY BASIS: ACTUAL/365(PROP) INTEREST PAYABLE VALUE 16-Feb-2026 WILL AMOUNT TO: GBP 1,195,298.21 PER GBP 331,065,000.00 DENOMINATION ...
-
Reltio Achieves AWS Financial Services Competency
REDWOOD SHORES, Calif.--(BUSINESS WIRE)--Reltio®, a context intelligence company, earned the Amazon Web Services (AWS) Financial Services Industry Competency status, a prestigious recognition for its deep experience and proven success delivering innovative, secure, scalable data solutions to the global financial services industry for its work with banks, insurers, capital markets and other financial services companies. "Achieving AWS Financial Services Industry Competency is a testament to Relt...

-
Citibank UK Regulatory Announcement: FRN Variable Rate Fix
LONDON--(BUSINESS WIRE)-- Re: MACQUARIE BANK LIMITED USD 35,000,000.00 MATURING: 14-Feb-2030 ISIN: XS2444207299 PLEASE BE ADVISED THAT THE INTEREST RATE FOR THE PERIOD 14-Nov-2025 TO 17-Feb-2026 HAS BEEN FIXED AT 4.65 PCT DAY BASIS: ACTUAL/360 INTEREST PAYABLE VALUE 17-Feb-2026 WILL AMOUNT TO: USD 429,940.05 PER USD 35,000,000.00 DENOMINATION ...
-
Beast Industries Acquires Step, Expanding its Platform to Include Financial Services
GREENVILLE, N.C.--(BUSINESS WIRE)--Beast Industries, the largest and most innovative creator based platform in the world, today announced the acquisition of Step, a financial technology company dedicated to making financial literacy and money management accessible to all. This acquisition marks a significant milestone for Beast Industries, bringing together Step's robust technology platform and full-stack fintech team with Beast Industries’ extensive audience reach and proven track record in ph...

-
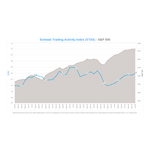
Schwab Trading Activity Index™: STAX Score Sees Highest Reading Since February 2025
WESTLAKE, Texas--(BUSINESS WIRE)--The Schwab Trading Activity Index™ (STAX) increased to 49.96 in January, up from its score of 48.48 in December. The only index of its kind, the STAX is a proprietary, behavior-based index that analyzes retail investor stock positions and trading activity from Schwab’s millions of client accounts to illuminate what investors were actually doing and how they were positioned in the markets each month. “After a one-month backtrack in December, Schwab clients retur...