

Newsroom
Sorted by: Latest
-
New Innovations in Ultimate Beneficial Owner (UBO) Discovery Drive 51% Growth in APAC Business Verification Volume for Trulioo
BANGKOK--(BUSINESS WIRE)--Trulioo Enables Leading Social Media Platform to Achieve Up to 40% Increase in UBO Coverage Across APAC with Next-Generation UBO Discovery...
-
2026 NAB Showが明日から開催、世界のメディアリーダーが一堂に会し、ストーリーテリングの未来を形作る
ワシントン--(BUSINESS WIRE)--(ビジネスワイヤ) -- 2026 NAB Showが4月18日(土)に開幕し、展示会場およびブースは4月19日にオープンします。この業界屈指のグローバルイベントでは、最も革新的な企業が注目を集め、メディア、エンターテインメント、テクノロジーの各分野から世界的に影響力のあるリーダーたちが一堂に会します。 NAB Showは、放送局、メディア企業、コンテンツクリエイター、そしてテクノロジー・イノベーターを大規模に結集させる唯一のプラットフォームとして、急速に進化するマルチプラットフォームの世界において、イノベーション、成長、そしてビジネスチャンスの創出を牽引する存在として、100年にわたる伝統を受け継いでいます。 NAB Showは、人工知能やクリエイターエコノミーから、スポーツ、ストリーミング、クラウド変革にいたるまで、ストーリーテリングの未来を推進するツール、人材、アイデアが集結する場となっています。 「NAB Showは、世界中のメディアエコシステムが一堂に会し、未来の可能性を探るだけでなく、それを構築する場としての役割を果たしてい...
-
Riassunto: Saildrone presenta Spectre, una nuova classe di imbarcazioni di superficie senza equipaggio ad alta velocità per operazioni navali
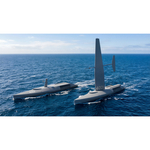
NATIONAL HARBOR, Md.--(BUSINESS WIRE)--Saildrone, il leader mondiale e l'operatore più esperto di veicoli di superficie senza equipaggio (USV), oggi ha rilasciato il progetto del Saildrone Spectre, il culmine di due anni di intenso lavoro di progettazione, basato su oltre 10 anni di esperienza operativa in ambito di USV. Con i suoi 52 metri (170 piedi) di lunghezza, 250 tonnellate di peso e velocità massima di 30 nodi, Spectre è la piattaforma Saildrone più grande, più veloce e più capace di se...

-
Ushio Industry & Entertainment nomina Takuya Matsumoto Presidente e CEO e indica la direzione strategica per la prossima fase
BERLINO--(BUSINESS WIRE)--Ushio Industry & Entertainment (Ushio INE GmbH) annuncia la nomina di Takuya Matsumoto a Presidente e Direttore generale, segnando una tappa storica nell'evoluzione dell'attività e la sua integrazione in Ushio Group. Con più di 20 anni di esperienza nel settore delle vendite, dello sviluppo di nuove attività e nelle operazioni globali, Takuya Matsumoto apporta profonde competenze e una solida esperienza in ruoli dirigenziali in Ushio. Più recentemente, Matsumoto ha...
-
Wolters Kluwer Future Ready CFO report shows APAC CFOs embrace AI with a governance‑first mindset, closely aligned with global peers
SINGAPORE--(BUSINESS WIRE)--CFOs across Asia‑Pacific are accelerating their engagement with artificial intelligence, according to the 2026 Future Ready CFO Survey – APAC Regional Insights. The findings show CFOs recognize AI’s growing influence on the finance function while advancing adoption in a deliberate, value‑driven manner. The survey shows that 83% of APAC CFOs cite the adoption and implementation of AI as a key force reshaping finance, closely aligned with the 85% global figure. This ne...
-
Presidio Investors Expands Portfolio with Strategic Investment in Edge Home Finance
AUSTIN, Texas--(BUSINESS WIRE)--Presidio Investors ("Presidio") has completed a strategic investment in Edge Home Finance, a mortgage brokerage platform. Headquartered in Minnetonka, MN, Edge Home Finance has built a strong reputation within the mortgage broker channel by empowering loan originators and delivering best-in-class service and innovation. The investment from Presidio represents an opportunity to leverage Edge’s momentum through enhanced investments in technology, operational infras...

-
Saildrone dévoile Spectre, une nouvelle catégorie de navires de surface sans pilote à grande vitesse destinés aux opérations navales
NATIONAL HARBOR, Maryland--(BUSINESS WIRE)--Saildrone, leader mondial et opérateur le plus expérimenté dans le domaine des véhicules de surface sans pilote (USV), a dévoilé aujourd’hui le design de Saildrone Spectre, aboutissement de deux années de travail intensif de conception, s’appuyant sur plus de 10 ans d’expérience opérationnelle en matière d’USV. Avec une longueur de 52 mètres (170 pieds), un poids de 250 tonnes et une vitesse pouvant atteindre 30 nœuds, Spectre est la plateforme Saildr...

-
Resumen: Saildrone presenta Spectre, una nueva clase de embarcación de superficie no tripulada de alta velocidad para operaciones navales
NATIONAL HARBOR, Maryland--(BUSINESS WIRE)--Saildrone, líder mundial y operador con mayor experiencia en vehículos de superficie no tripulados (USV), ha presentado hoy el diseño de Saildrone Spectre, una nueva clase de embarcación de superficie no tripulada de alta velocidad para operaciones navales, resultado de dos años de intenso trabajo de desarrollo y de más de una década de experiencia operativa en USV. Con 52 metros de eslora (170 pies), un peso de 250 toneladas y una velocidad máxima de...
-
The Many Acquires Majority Stake in Immersive Technology Studio CatalystXR, Expanding Global Participation Capabilities
LOS ANGELES--(BUSINESS WIRE)--The Many, the independent agency known for building participation-led brands and businesses, today announced the acquisition of a majority stake in CatalystXR, an Australian immersive technology studio specializing in XR, VR, AR, and large-scale interactive environments. CatalystXR founder Jamie Gilroy joins The Many as Partner in Charge of Participatory Technology. The acquisition marks the latest chapter in The Many's global expansion, which now spans offices in...
-
Mizuho Securities Adopts Behavox to Establish AI-Powered Communications Monitoring Framework
TOKYO--(BUSINESS WIRE)--Behavox, the AI company that helps organizations safeguard and enhance their businesses through a unified controls framework, today announced that Mizuho Securities, the securities arm of Mizuho Financial Group and one of Japan’s most prominent investment banking and securities firms, has successfully implemented Behavox Quantum AI for communications surveillance. The deployment delivers end-to-end traceability from initial discovery through to resolution, marking a stra...