

Newsroom
Sorted by: Latest
-
Mitsubishi Electric to Rename Thai Subsidiary Siam Compressor Industry
TOKYO--(BUSINESS WIRE)--Mitsubishi Electric Corporation (TOKYO: 6503) announced today that its Thai subsidiary, Siam Compressor Industry Co., Ltd., which develops, manufactures and sells compressors for air conditioning and refrigeration equipment, will change its name to Mitsubishi Electric Siam Compressor Industry Co., Ltd. effective April 1. In addition to supplying Mitsubishi Electric group companies, Siam Compressor Industry provides a wide range of compressors to other air conditioning eq...
-
REJO lleva el dispositivo modular CUBE a Japón en su estreno mundial
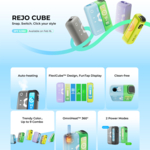
TOKIO--(BUSINESS WIRE)--REJO, un proveedor mundial pionero de soluciones de calor sin combustión (HNB), anunció hoy el debut mundial de REJO CUBE, su último dispositivo HNB modular, en Japón. Rompiendo con las normas de diseño convencionales de HNB, REJO CUBE presenta una nueva y audaz opción de dispositivo con un diseño moderno y una experiencia de inhalación de modo dual, que se lanzará en los principales canales minoristas de comercio electrónico de Japón a partir del 16 de febrero. Este lan...
-
Esslinger debütiert in Deutschland: Die Vexel-Serie als Plattform für ein modulares ergonomisches Arbeitsplatzsystem
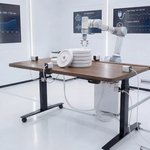
BERLIN--(BUSINESS WIRE)--Esslinger gibt heute sein Public-Media-Debüt in Deutschland bekannt und startet am 15. Februar den exklusiven Online-Verkauf der Vexel-Serie über Esslingerlife.de. Die Marke richtet sich an Programmierer und intensive Bildschirmnutzer und versteht den höhenverstellbaren Schreibtisch (Sitz-Steh-Schreibtisch) nicht als Möbelstück, sondern als modulares ergonomisches Arbeitsplatzsystem: Der Tisch ist die Plattform, das Zubehör-Ökosystem (Schreibtischzubehör) der Kern der L...

-
Esslinger Debuts in Germany: Vexel Sit-Stand Desk Series as a Platform for a Modular Ergonomic Workstation Ecosystem
BERLIN--(BUSINESS WIRE)--Esslinger today announced its public-media debut in Germany and the official online launch of its Vexel Series on Esslingerlife.de, starting February 15. Built for programmers and heavy computer users, Esslinger positions the height-adjustable sit-stand desk not as a piece of furniture, but as a modular ergonomic workstation system—where the desk is the platform and the accessory ecosystem is the core solution. Long-session strain rarely comes from one item. It accumula...
-
REJO brings CUBE modular device to Japan in its global premiere
TOKYO--(BUSINESS WIRE)--REJO, a pioneering global provider of heat-not-burn (HNB) solutions, today announced the global debut of REJO CUBE, its latest modular HNB device, in Japan. Breaking away from conventional HNB design norms, REJO CUBE introduces a bold new device option featuring a trendy design and dual-mode inhalation experience, launching on Japan’s major e-commerce retail channels from February 16. This launch marks the brand’s latest move following REJO Mate Air’s introduction in Jap...

-
Great Lakes Dredge Investor Alert: Kahn Swick & Foti, LLC Investigates Adequacy of Price and Process in Proposed Sale of Great Lakes Dredge & Dock Corporation - GLDD
NEW YORK & NEW ORLEANS--(BUSINESS WIRE)--Former Attorney General of Louisiana Charles C. Foti, Jr., Esq. and the law firm of Kahn Swick & Foti, LLC (“KSF”) are investigating the proposed sale of Great Lakes Dredge & Dock Corporation (NasdaqGS: GLDD) to Saltchuk Resources, Inc. Under the terms of the proposed transaction, shareholders of Great Lakes will receive $17.00 in cash for each share of Great Lakes that they own. KSF is seeking to determine whether this consideration and the proc...

-
Synopsys Investigation Initiated: Kahn Swick & Foti, LLC Investigates the Officers and Directors of Synopsys, Inc. - SNPS
NEW YORK & NEW ORLEANS--(BUSINESS WIRE)--Former Attorney General of Louisiana, Charles C. Foti, Jr., Esq., a partner at the law firm of Kahn Swick & Foti, LLC (“KSF”), announces that KSF has commenced an investigation into Synopsys, Inc. (“Synopsys” or the “Company”) (NasdaqGS: SNPS). In February 2025, Cangrade, Inc., a hiring assessment platform provider, filed a lawsuit against Synopsys, Inc. in federal court in the Northern District of California, alleging misappropriation of trade secre...

-
Tri Pointe Homes Investor Alert: Kahn Swick & Foti, LLC Investigates Adequacy of Price and Process in Proposed Sale of Tri Pointe Homes, Inc. - TPH
NEW YORK & NEW ORLEANS--(BUSINESS WIRE)--Former Attorney General of Louisiana Charles C. Foti, Jr., Esq. and the law firm of Kahn Swick & Foti, LLC (“KSF”) are investigating the proposed sale of Tri Pointe Homes, Inc. (NYSE: TPH) to Sumitomo Forestry Co., Ltd. Under the terms of the proposed transaction, shareholders of Tri Pointe will receive $47.00 in cash for each share of Tri Pointe that they own. KSF is seeking to determine whether this consideration and the process that led to it are...

-
Resumen: Estithmar Holding crea «Estithmar Capital» para la gestión de inversiones financieras
DOHA, Catar--(BUSINESS WIRE)--Estithmar Holding Q.P.S.C. acaba de anunciar la creación de su quinto grupo, «Estithmar Capital», en el marco de una estrategia destinada a impulsar la expansión de la compañía y diversificar las industrias en las que opera. Estithmar Capital se especializará en la gestión de inversiones financieras, el fortalecimiento de la gobernanza institucional y las operaciones conforme a marcos claros de cumplimiento normativo, regulación y gestión de riesgos, en consonancia...

-
Estithmar Holding gründet „Estithmar Capital“ für Finanzinvestitionsmanagement
DOHA, Katar--(BUSINESS WIRE)--Estithmar Holding Q.P.S.C. hat heute die Gründung seiner fünften Gruppe, „Estithmar Capital“, als strategischen Schritt zur Förderung der Expansion des Unternehmens sowie zur Diversifizierung der Sektoren, in denen es tätig ist, bekannt gegeben. Estithmar Capital wird sich auf das Management von Finanzinvestitionen, die Stärkung der institutionellen Governance sowie die Geschäftstätigkeit im Rahmen klarer Compliance-, Regulierungs- und Risikomanagement-Frameworks s...
