

Newsroom
Sorted by: Latest
-
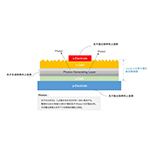
SETi:米連邦裁判所、「類似製品および関与した従業員」まで永久差止命令
米サウスカロライナ州コロンビア--(BUSINESS WIRE)--(ビジネスワイヤ) -- 2026年2月、米連邦裁判所は、100年の歴史を持つグローバル光学企業「レーザーコンポーネンツ(Laser Components)」が、25年間にわたり光半導体の研究開発および生産に専念してきた米国企業「SETi」の特許を侵害したとして、関連製品の恒久的販売差止命令を下した。本判決は、侵害技術を使用した製造・販売にとどまらず、これに関与した役員および従業員にも適用される。 本特許技術は、今後10年以内にメモリ市場の4分の1規模である500億ドル($50B)に成長すると見込まれる光半導体市場における将来の中核技術の一つである。電気エネルギーを光エネルギーへ変換する同技術は、スマートフォンに代わるARグラス(AR Glass)への応用に加え、AIの消費電力を低減するためのHBM半導体にも活用される予定である。 特許の核心は、半導体電流および各層構造を最適化することで光子生成を最大化し、生成された光子の半導体内部での損失(Photon loss)を極小化する性能向上技術にある。 今回の判決の重要な...
-
CenterPoint Energy, Inc. Announces Pricing of Upsized Offering of $600 Million of 2.875% Convertible Senior Notes Due 2029
HOUSTON--(BUSINESS WIRE)--CenterPoint Energy, Inc. (NYSE: CNP) or “CenterPoint” today announced the pricing of its offering of $600 million aggregate principal amount of its 2.875% Convertible Senior Notes due 2029 (the “convertible notes”) in a private placement to persons reasonably believed to be qualified institutional buyers pursuant to Rule 144A under the Securities Act of 1933, as amended (the “Securities Act”). The size of the offering was increased from the previously announced $550 mi...
-
キオクシア:次世代モバイル機器向けUFS 5.0対応組み込み式フラッシュメモリ製品のサンプル出荷について
東京--(BUSINESS WIRE)--(ビジネスワイヤ) -- キオクシア株式会社は、JEDECで規格策定中の次世代UFS規格UFS 5.0に対応する 組み込み式フラッシュメモリ(UFS 5.0製品)の評価用サンプル[注1] の出荷を本日から開始します。[注2] UFS 5.0は オンデバイスAI機能を持つハイエンド・スマートフォンなど次世代モバイル機器で要求される性能を満たすためJEDECで策定中の新規組み込み式フラッシュストレージの標準規格で、物理層にMIPI M-PHY version 6.0、プロトコルに UniPro version 3.0を採用しています。M-PHY version 6.0 では新たにHS-GEAR6モードが導入され、理論上最大1 laneあたり 46.6 Gbpsのインターフェーススピードをサポート、2 laneのUFS 5.0では約10.8 GB/sの実効読み書き性能が実現可能です。 評価用サンプルは 当社がUFS 5.0向けに 新規開発した コントローラーと第8世代 BiCS FLASH™を搭載し、512 GB、1 TBの容量をラインアップします...

-
Kioxia Sampling UFS 5.0 Embedded Flash Memory Devices for Next-Generation Mobile Applications
TOKYO--(BUSINESS WIRE)--Kioxia Corporation announced that it has begun shipping samples of embedded flash memory compatible with the next-generation UFS standard, UFS 5.0....
-
Kioxia Sampling UFS 5.0 Embedded Flash Memory Devices for Next-Generation Mobile Applications
SAN JOSE, Calif.--(BUSINESS WIRE)--Kioxia is now sampling UFS 5.0 embedded flash memory devices....

-
Teradyne to Showcase Leading Semiconductor Test Solutions at IESA Vision Summit
NORTH READING, Mass.--(BUSINESS WIRE)--Teradyne will exhibit its latest innovations at the 2026 IESA Vision Summit, 25-26 February at the Leela Bhartiya City Convention Centre in Bengaluru....
-
El Empire State Building presenta el primer paquete de fiestas de cumpleaños infantiles para festejar en el observatorio más emblemático
NUEVA YORK--(BUSINESS WIRE)--Finalmente se cumplió el deseo de los padres que buscaban la mejor idea para festejar los cumpleaños de sus hijos. Hoy, el Empire State Building (ESB) presentó su primer paquete de fiestas de cumpleaños infantiles en el observatorio de este símbolo internacional, en el marco de las celebraciones por su 95.o aniversario, que durarán todo el año. "A los niños les encanta el Empire State Building porque hay desde juegos de Lego hasta lectores de Percy Jackson, y ahora,...

-
Laird Superfood to Report Fourth Quarter and Fiscal Year 2025 Financial Results on March 26, 2026
BOULDER, Colo.--(BUSINESS WIRE)--Laird Superfood, Inc. (NYSE American: LSF) will report financial results for the fourth quarter and fiscal year ended December 31, 2025 on Thursday, March 26, 2026 after market close. Management will host a webcast at 5:00 p.m. ET on the same day to discuss the results. Participants may access the live webcast on the Laird Superfood Investor Relations website at https://investors.lairdsuperfood.com/ under “Events.” About Laird Superfood (NYSE American: LSF) Lair...
-
proteanTecs 与孤波科技强强联手,为先进半导体系统提供统一分析解决方案
以色列海法与中国上海--(BUSINESS WIRE)--(美国商业资讯)-- 先进电子产品深度数据健康与性能监控解决方案的领先提供商 proteanTecs® 与中国首家硅后工作流自动化解决方案提供商上海孤波科技有限公司(Gubo Technologies Co., Ltd.)今日宣布建立合作关系,携手提供联合半导体分析解决方案。这项合作旨在为先进电子设备提供涵盖芯片与系统全生命周期内良率、质量、性能及可靠性的广泛而可行的深入见解。 随着各公司加速技术研发以支持大规模人工智能应用,半导体行业正经历快速变革。这一转变对全球高性能计算、数据中心、云基础设施、汽车电子及电信市场的能效、计算性能和运营可靠性提出了更高要求。应对这些挑战,需要更深入地了解设备在整个生产和生命周期内的运行情况。 通过此次合作,proteanTecs 与孤波科技计划提供互补的集成解决方案,发挥双方各自的技术领先优势,助力实现设备生产各阶段的数据驱动决策。整合方案将融合 proteanTecs 的片上智能体(Agents)和高级分析技术,以及孤波科技的 OneData 平台与云端分析能力。该整合解决方案将覆盖设计、制...
-
RAL INVESTOR ALERT: Kirby McInerney LLP Investigates Potential Claims Involving Ralliant Corporation
NEW YORK--(BUSINESS WIRE)--The law firm of Kirby McInerney LLP continues its investigation on behalf of Ralliant Corporation (“Ralliant” or the “Company”) (NYSE:RAL) investors concerning the Company’s and/or members of its senior management’s possible violation of the federal securities laws and other unlawful business practices. [LEARN MORE ABOUT THE INVESTIGATION] What Happened? On February 4, 2026, Ralliant reported fourth quarter and full year 2025 results, revealing a “$1.4 billion non-cas...