Newsroom
Sorted by: Latest
-
GAIA, INC. INVESTOR ALERT: Kirby McInerney LLP Announces Investigation Into Potential Securities Fraud
NEW YORK--(BUSINESS WIRE)--The law firm of Kirby McInerney LLP is investigating potential claims against Gaia, Inc. (“Gaia” or the “Company”) (NASDAQ:GAIA). The investigation concerns whether the Company and/or members of its senior management may have violated federal securities laws or engaged in other unlawful business practices. [LEARN MORE ABOUT THE INVESTIGATION] What Happened? On May 4, 2026, Gaia issued a press release announcing its first quarter 2026 financial results. Among other ite...
-
Andersen Global udvider sin afrikanske platform med tilføjelsen af medlemsfirma i Namibia
SAN FRANCISCO--(BUSINESS WIRE)--Andersen Global udbygger sin tilstedeværelse i Afrika med tilføjelsen af Andersen in Namibia, da Windhoek Advisory & Taxation tager Andersen-brandet til sig og styrker sine forudsætninger for at betjene virksomheder med aktiviteter i et af det sydlige Afrikas dynamiske vækstmarkeder. Andersen in Namibia har været et samarbejdsfirma siden 2021 og er en lokalt ejet revisions- og konsulentvirksomhed, der leverer ydelser inden for regnskab, skat og forretningsråd...
-
Monolithic Power Investor News: Rosen Law Firm Announces Investigation of Breaches of Fiduciary Duties by the Directors and Officers of Monolithic Power Systems, Inc. – MPWR
NEW YORK--(BUSINESS WIRE)--Rosen Law Firm, a global investor rights law firm, announces an investigation of potential breaches of fiduciary duties by the directors and officers of Monolithic Power Systems, Inc. (NASDAQ: MPWR). If you currently own shares of Monolithic Power stock, please visit the firm’s website at https://rosenlegal.com/submit-form/?case_id=34600 for more information. You may also contact Phillip Kim of Rosen Law Firm toll free at 866-767-3653 or via email at case@rosenlegal.c...
-
Andersen Global amplía su presencia en África al incorporar una firma miembro en Namibia
SAN FRANCISCO--(BUSINESS WIRE)--Andersen Global promueve su crecimiento en África al incorporar Andersen en Namibia, tras haber adoptado la marca Andersen por parte de Windhoek Advisory & Taxation y consolida así su capacidad para prestar servicios a las empresas que operan en uno de los mercados emergentes más dinámicos del sur de África. Andersen in Namibia es una firma colaboradora desde 2021, que presta servicios profesionales de propiedad local y se especializa en contabilidad, temas f...
-
Andersen Global zwiększa zasięg w Afryce wraz z dołączeniem firmy członkowskiej w Namibii
SAN FRANCISCO--(BUSINESS WIRE)--Andersen Global realizuje kolejny etap rozwoju w Afryce wraz z otwarciem Andersen in Namibia – firma Windhoek Advisory & Taxation przyjmuje szyld Andersen, wzmacniając swoje zdolności do świadczenia usług przedsiębiorstwom prowadzącym działalność na jednym z najbardziej dynamicznych rynków wschodzących Afryki Południowej. Andersen in Namibia, która pod poprzednią nazwą współpracowała ze stowarzyszeniem od 2021 r., jest lokalną firmą świadczącą wyspecjalizowan...
-
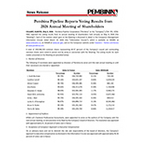
Pembina Pipeline Reports Voting Results from 2026 Annual Meeting of Shareholders
CALGARY, Alberta--(BUSINESS WIRE)--Pembina Pipeline Corporation ("Pembina" or the "Company") (TSX: PPL; NYSE: PBA) reported the voting results from its annual meeting of shareholders held virtually on May 8, 2026 (the "Meeting"). Each of the matters voted upon at the Meeting is discussed in detail in the Company's Management Information Circular dated March 19, 2026 (the "Information Circular"), which is available on SEDAR+ at www.sedarplus.ca, on EDGAR at www.sec.gov, and on the Company's webs...
-
Andersen Global expande sua plataforma africana com adição de uma empresa membro na Namíbia
SAN FRANCISCO--(BUSINESS WIRE)--A Andersen Global amplia seu crescimento na África com a chegada da Andersen à Namíbia, enquanto a Windhoek Advisory & Taxation adota a marca Andersen, reforçando assim sua capacidade de atender empresas que operam em um dos mercados emergentes mais dinâmicos da África Meridional. Como parceira na Namíbia desde 2021, a Andersen é uma empresa local de serviços profissionais que oferece serviços de contabilidade, impostos e consultoria empresarial, adaptados às...
-
NUBURU velocizza la strategia per le piattaforme militari e per la sicurezza, con progressi sul percorso Golden Power per Tekne e l'espansione della roadmap per i laser a energia diretta
DENVER--(BUSINESS WIRE)--NUBURU, Inc. (NYSE American: BURU), azienda attiva nel settore della difesa e della sicurezza dotata di una piattaforma a doppio scopo focalizzata su effetti non cinetici, tecnologie a energia diretta, guerra elettronica e sistemi militari orchestrati via software, oggi ha divulgato un importante aggiornamento strategico sull'espansione continuativa della sua piattaforma integrata di difesa e sicurezza grazie al progresso nella roadmap dei prodotti laser Lyocon e all'it...
-
Mineros S.A. to Repurchase Shares in Colombia Commencing May 11, 2026
MEDELLIN, Colombia--(BUSINESS WIRE)--Mineros S.A. (TSX:MSA, OTCQX:MNSAF, BVC:MINEROS) (“Mineros” or the “Company”), a leading gold producer in Latin America, will commence an offer to repurchase its common shares (an Oferta de Readquisicion de Acciones, or “ORA”) through the facilities of the Colombian Stock Exchange for five business days starting today, Monday, May 11, 2026, and ending on May 15, 2026. The maximum aggregate value of the common shares to be repurchased under the ORA will be $1...
-
WHOOP expande su plataforma de salud con consultas clínicas a demanda y nuevas funciones impulsadas por inteligencia artificial
BOSTON--(BUSINESS WIRE)--WHOOP, la empresa especializada en rendimiento humano, presentó una nueva serie de funciones de salud impulsadas por inteligencia artificial para sus membresías, en un nuevo paso dentro de su evolución hacia una plataforma inteligente de salud. Estas incorporaciones refuerzan el compromiso de la empresa con el desarrollo de información más personalizada, precisa y accionable, y amplían su propuesta más allá de la optimización del rendimiento para sumar herramientas de s...