
")
")
")
IRVINE, Calif.--(BUSINESS WIRE)--CoreLogic® (NYSE: CLGX), a leading global property information, analytics and data-enabled solutions provider, today released its CoreLogic Home Price Index (HPI™) and HPI Forecast™ for March 2017, which shows home prices are up both year over year and month over month.
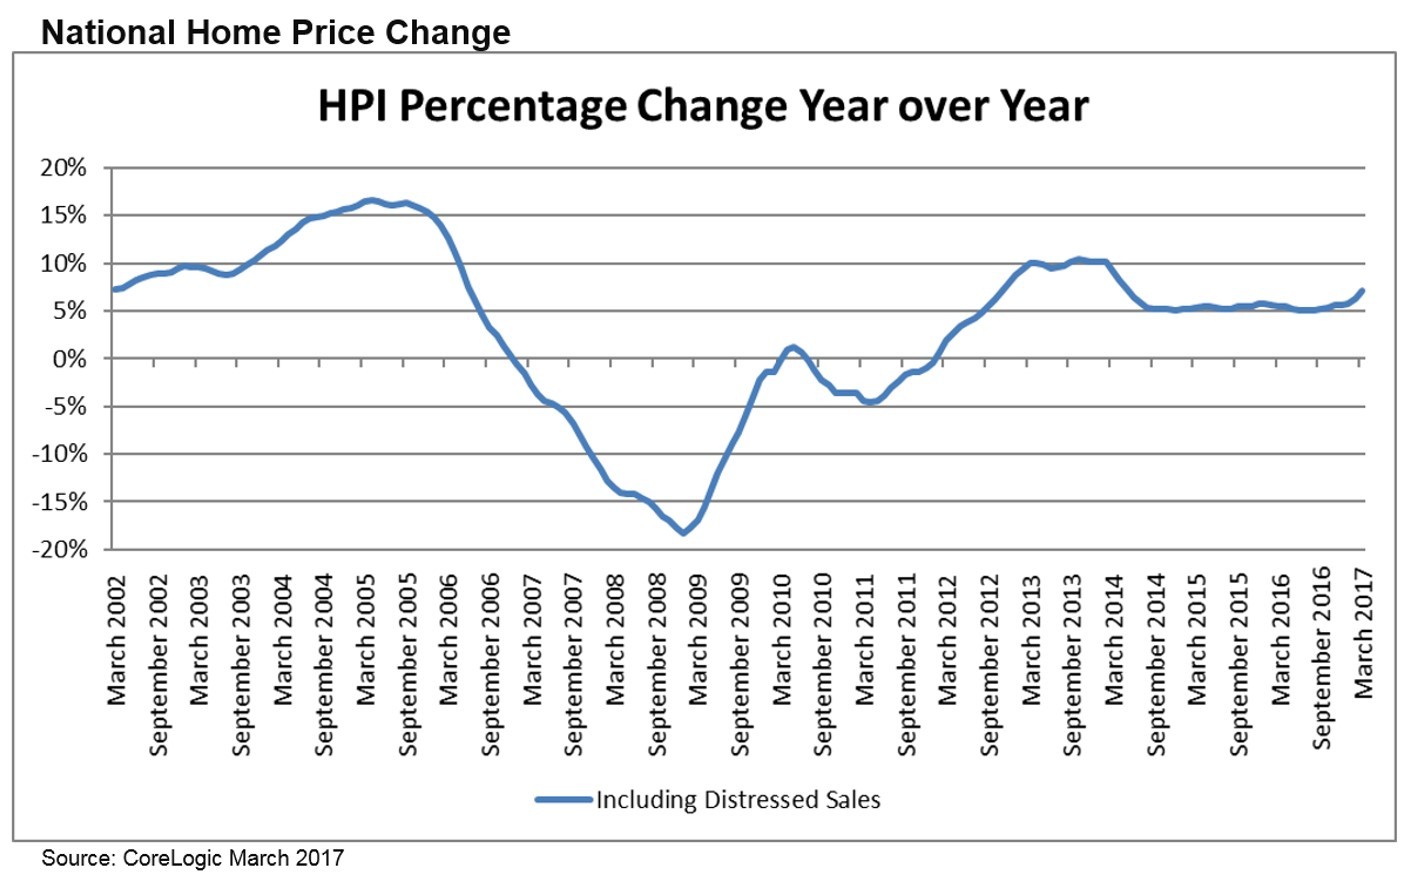
Home prices nationwide, including distressed sales, increased year over year by 7.1 percent in March 2017 compared with March 2016 and increased month over month by 1.6 percent in March 2017 compared with February 2017,* according to the CoreLogic HPI.
The CoreLogic HPI Forecast indicates that home prices will increase by 4.9 percent on a year-over-year basis from March 2017 to March 2018, and on a month-over-month basis home prices are expected to increase by 0.6 percent from March 2017 to April 2017. The CoreLogic HPI Forecast is a projection of home prices using the CoreLogic HPI and other economic variables. Values are derived from state-level forecasts by weighting indices according to the number of owner-occupied households for each state.
“Home prices posted strong gains in March 2017, and the CoreLogic Home Price Index is only 2.8 percent from its 2006 peak,” said Dr. Frank Nothaft, chief economist for CoreLogic. “With a forecasted increase of almost 5 percent over the next 12 months, the index is expected to reach the previous peak during the second half of this year. Prices in more than half the country have already surpassed their previous peaks, and almost 20 percent of metropolitan areas are now at their price peaks. Nationally, price growth has gradually accelerated over the past half-year, while rent growth for single-family rental homes has slowly decelerated over the same period, according to the CoreLogic Single-Family Rental Index, recording a 3 percent rise over the year through March.”
“A potent mix of strong job gains, household formation, population growth and still-attractive mortgage rates in the face of tight inventories are fueling a continuing surge in home prices across the U.S.,” said Frank Martell, president and CEO of CoreLogic. “Price gains were broad-based with 90 percent of metropolitan areas posting year-over-year gains. Major metropolitan areas were especially hot with CoreLogic data indicating that four of the largest 10 markets are now overvalued. Geographically, gains were strongest in the West with Washington showing the highest appreciation at almost 13 percent, and Seattle, Tacoma and Bellingham posting gains of 13 to 14 percent.”
*February data was revised. Revisions with public records data are standard, and to ensure accuracy, CoreLogic incorporates the newly released public data to provide updated results.
Methodology
The CoreLogic HPI™ is built on industry-leading public record, servicing and securities real-estate databases and incorporates more than 40 years of repeat-sales transactions for analyzing home price trends. Generally released on the first Tuesday of each month with an average five-week lag, the CoreLogic HPI is designed to provide an early indication of home price trends by market segment and for the Single-Family Combined tier representing the most comprehensive set of properties (including all sales for Single-Family Attached and Single-Family Detached properties). The indexes are fully revised with each release and employ techniques to signal turning points sooner. The CoreLogic HPI provides measures for multiple market segments, referred to as tiers, based on property type, price, time between sales, loan type (conforming vs. non-conforming) and distressed sales. Broad national coverage is available from the national level down to ZIP Code, including non-disclosure states.
CoreLogic HPI Forecasts™ are based on a two-stage, error-correction econometric model that combines the equilibrium home price—as a function of real disposable income per capita—with short-run fluctuations caused by market momentum, mean-reversion, and exogenous economic shocks like changes in the unemployment rate. With a thirty-year forecast horizon, CoreLogic HPI Forecasts project CoreLogic HPI levels for two tiers—Single-Family Combined (both Attached and Detached) and Single-Family Combined excluding distressed sales. As a companion to the CoreLogic HPI Forecasts, Stress-Testing Scenarios align with Comprehensive Capital Analysis and Review (CCAR) national scenarios to project five years of home prices under baseline, adverse and severely adverse scenarios at state, CBSA and ZIP Code-levels. The forecast accuracy represents a 95-percent statistical confidence interval with a +/- 2.0 percent margin of error for the index.
Source: CoreLogic
The data provided are for use only by the primary recipient or the primary recipient's publication or broadcast. This data may not be resold, republished or licensed to any other source, including publications and sources owned by the primary recipient’s parent company without prior written permission from CoreLogic. Any CoreLogic data used for publication or broadcast, in whole or in part, must be sourced as coming from CoreLogic, a data and analytics company. For use with broadcast or web content, the citation must directly accompany first reference of the data. If the data are illustrated with maps, charts, graphs or other visual elements, the CoreLogic logo must be included on screen or website. For questions, analysis or interpretation of the data, contact Lori Guyton at lguyton@cvic.com or Bill Campbell at bill@campbelllewis.com. Data provided may not be modified without the prior written permission of CoreLogic. Do not use the data in any unlawful manner. The data are compiled from public records, contributory databases and proprietary analytics, and its accuracy is dependent upon these sources.
About CoreLogic
CoreLogic (NYSE: CLGX) is a leading global property information, analytics and data-enabled solutions provider. The company's combined data from public, contributory and proprietary sources includes over 4.5 billion records spanning more than 50 years, providing detailed coverage of property, mortgages and other encumbrances, consumer credit, tenancy, location, hazard risk and related performance information. The markets CoreLogic serves include real estate and mortgage finance, insurance, capital markets, and the public sector. CoreLogic delivers value to clients through unique data, analytics, workflow technology, advisory and managed services. Clients rely on CoreLogic to help identify and manage growth opportunities, improve performance and mitigate risk. Headquartered in Irvine, Calif., CoreLogic operates in North America, Western Europe and Asia Pacific. For more information, please visit www.corelogic.com.
CORELOGIC, the CoreLogic logo, CoreLogic HPI, CoreLogic HPI Forecast and HPI are trademarks of CoreLogic, Inc. and/or its subsidiaries.