

Newsroom
Sorted by: Latest
-
Citibank UK Regulatory Announcement: FRN Variable Rate Fix
LONDON--(BUSINESS WIRE)-- Re: BANK OF AMERICA CORPORATION EUR 1,000,000,000.00 MATURING: 30-Oct-2029 ISIN: XS3217583395 PLEASE BE ADVISED THAT THE INTEREST RATE FOR THE PERIOD 30-Jul-2026 TO 30-Oct-2026 HAS BEEN FIXED AT 3.04 PCT DAY BASIS: ACTUAL/360 INTEREST PAYABLE VALUE 30-Oct-2026 WILL AMOUNT TO: EUR 7,781,666.67 PER EUR 1,000,000,000.00 DENOMINATION ...
-
Owner Robert Balzebre’s Solei Beach Club Debuts Seafood-Forward Mediterranean Dining in Miami Beach
MIAMI BEACH, Fla.--(BUSINESS WIRE)--Solei Beach Club, the 11,500-square-foot oceanfront day club opened by hotelier Robert Balzebre’s Chisholm Properties South Beach at the Kimpton Surfcomber Hotel, has launched a chef-driven Mediterranean dining program led by Executive Chef Gastón. The kitchen at 1717 Collins Avenue serves daily from 11 a.m. to 5 p.m., with the bar pouring until 6 p.m., and the full menu is available to hotel guests, locals, and visitors alike. The program arrives as Miami Be...

-
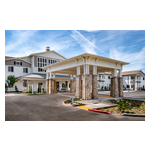
Clarion Partners Acquires Clearwater at Sonoma Hills, Expanding Presence in High-Growth Northern California Senior Housing Market
NEW YORK--(BUSINESS WIRE)--Clarion Partners, a leading real estate investment manager and majority-owned investment group of Franklin Templeton, today announced the acquisition of Clearwater at Sonoma Hills, a premier 94-unit senior living community in Rohnert Park, California. The acquisition further strengthens the firm's investment in high-quality senior housing assets located in attractive, supply-constrained markets with strong long-term demographic fundamentals. Built in 2020, Clearwater...
-
UK Debt Management Office UK Regulatory Announcement: Issue of Debt
LONDON--(BUSINESS WIRE)-- The Minster Building 21 Mincing Lane London EC3R 7AG Tel 020 7862 6500 www.dmo.gov.uk 28 July 2026 PRESS NOTICE AUCTION OF BRITISH GOVERNMENT STOCK Auction Details Auction Date Tuesday, 4 August 2026 Issue and Settlement Date Wednesday, 5 August 2026 Bidding Convention Fully paid Bid Price (see Note 1) Accrued Interest payable with bid Nil Auction Open 9:00am London Time Auction Close 10:00am London Time Post Auction Option Facility Open 12:30pm London...
-
The Cheesecake Factory Celebrates National Cheesecake Day July 30 With Any Slice, Half Price for All Dine-In Guests
CALABASAS HILLS, Calif.--(BUSINESS WIRE)--The Cheesecake Factory Incorporated (NASDAQ:CAKE): What On Thursday, July 30, The Cheesecake Factory® (NASDAQ: CAKE) is celebrating its favorite holiday – National Cheesecake Day – by offering any slice of its more than 30 legendary flavors of cheesecake for half price to all dine-in guests*, and introducing its newest flavor: Brownie Crunch Choc-a-Lot Cheesecake. The Brownie Crunch Choc-a-Lot Cheesecake is creamy milk and white chocolate marbled chee...

-
Merit and EdgeTunePower Launch Strategic Partnership to Deliver Grid-Ready AI Power Infrastructure
BETHLEHEM, Pa.--(BUSINESS WIRE)--Merit and EdgeTunePower Inc. (ETP) announce a strategic partnership to accelerate the deployment of grid-ready, mission-critical power infrastructure....

-
GROUPE SEB : MISE A DISPOSITION DU RAPPORT FINANCIER SEMESTRIEL 2026
ECULLY, France--(BUSINESS WIRE)--Regulatory News: Le Groupe SEB (Paris:SK) annonce avoir mis à disposition sur son site internet son Rapport Financier Semestriel 2026. Il intègre notamment : les états financiers consolidés résumés au 30 juin 2026 ; le rapport semestriel d’activité ; la déclaration du responsable du rapport financier semestriel ; et le rapport des Commissaires aux comptes sur l’examen limité des comptes consolidés semestriels. Ce document est disponible en versions française et...
-
Groupe SEB: 2026 Half-Year Financial Report Available
ECULLY, France--(BUSINESS WIRE)--Regulatory News: Groupe SEB (Paris:SK) announces that its 2026 Half-year Financial Report is now available on its website. It includes: the condensed consolidated financial statements as of June 30th, 2026; the half-year activity report; the statement by the person responsible for the half-year financial report; and the Statutory Auditors' report on the half-year consolidated financial statements. This document is available in French and in English, under the co...
-
FHLBank Chicago Adds Additional $17 Million to 2026 Downpayment Plus® Programs, Bringing Total Funding to $48 Million
CHICAGO--(BUSINESS WIRE)--FHLBank Chicago today announced an additional $17 million commitment to its Downpayment Plus® programs, bringing total 2026 funding to $48 million....
-
Church’s Texas Chicken Secures Strategic Growth Equity Investment From Golub Capital
ATLANTA--(BUSINESS WIRE)--Church's Texas Chicken, a global chicken quick service restaurant (QSR) brand with more than 1,500 restaurants across the U.S. and 25+ international markets, announced a strategic growth equity investment from Golub Capital. The investment provides Church’s with significant new capital to accelerate its next phase of its growth, building on several years of brand transformation, operational improvement, and record-setting performance across the system. Founded in 1952...