

Newsroom
Sorted by: Latest
-
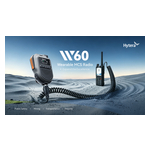
Hytera Launches W60 Wearable MCS Radio to Extend Mission-Critical Communication Beyond PMR Coverage
LONDON--(BUSINESS WIRE)--Hytera today launched the W60 Wearable MCS Radio at Critical Communications World (CCW) 2026....
-
First Trust Global Funds PLC UK Regulatory Announcement: Net Asset Value(s)
LONDON--(BUSINESS WIRE)-- Funds Date TIDM ISIN Code Shares in Issue Currency Net Asset Value NAV/per Share First Trust Nasdaq Cybersecurity UCITS ETF 22.06.2026 NQCYBREN IE00BF16M727 27,230,042.00 USD 1,410,531,254.23 51.801 ...
-
First Trust Global Funds PLC UK Regulatory Announcement: Net Asset Value(s)
LONDON--(BUSINESS WIRE)-- Funds Date TIDM ISIN Code Shares in Issue Currency Net Asset Value NAV/per Share First Trust Nasdaq Clean Edge Smart Grid Infrastructure UCITS ETF 22.06.2026 GRDU.LN IE000J80JTL1 40,475,002.00 USD 2,773,210,048.63 68.517 ...
-
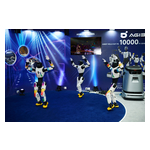
AGIBOT Showcases Embodied AI Robots at VivaTech 2026 in Paris
PARIS--(BUSINESS WIRE)--AGIBOT, a global leader in embodied AI and robotics, presented its embodied AI robotics portfolio at VivaTech 2026 in Paris. The company conducted live demonstrations across interaction, locomotion, manipulation, and multi-robot coordination. As part of VivaTech’s 10th-anniversary celebration, AGIBOT participated in the public technology showcase on the Champs-Élysées, where visitors experienced humanoid robotics alongside other emerging technologies. At the main VivaTec...
-
AGIBOT présente ses robots dotés d’une IA embarquée au salon VivaTech 2026 à Paris
PARIS--(BUSINESS WIRE)--AGIBOT, un chef de file mondial dans le domaine de l’IA embarquée (« embodied AI ») et de la robotique, a présenté son portefeuille de solutions robotiques basées sur l’IA embarquée lors du salon VivaTech 2026 à Paris. L’entreprise a effectué des démonstrations en direct mettant en avant l’interaction, la locomotion, la manipulation et la coordination entre plusieurs robots. À l’occasion des célébrations du 10e anniversaire de VivaTech, AGIBOT a participé à une démonstra...

-
Kold Investments Issues Open Letter to Prosus Board of Directors
COPENHAGEN, Denmark--(BUSINESS WIRE)--Kold Investments, a long-term oriented investment firm and shareholder of Prosus N.V. (“Prosus”) (AEX: PRX, JSE: PRX), today published “The Prosus Emperor’s New AI Clothes,” an open letter in the form of a fairy tale addressed to the Board of Directors of Prosus. The tale may be read here: http://the-prx-emperor.com Kold Investments believes Prosus has a straightforward, low-risk way to maximize long-term net asset value per share: maximize NAV-per-share ac...
-
First Trust Global Funds PLC UK Regulatory Announcement: Net Asset Value(s)
LONDON--(BUSINESS WIRE)-- Funds Date TIDM ISIN Code Shares in Issue Currency Net Asset Value NAV/per Share First Trust Alerian Disruptive Technology Real Estate UCITS ETF 22.06.2026 LANDXEN.LN IE000C75IMX8 15,878.00 USD 314,237.33 19.791 ...
-
First Trust Global Funds PLC UK Regulatory Announcement: Net Asset Value(s)
LONDON--(BUSINESS WIRE)-- Funds Date TIDM ISIN Code Shares in Issue Currency Net Asset Value NAV/per Share First Trust Alerian Disruptive Technology Real Estate UCITS ETF 22.06.2026 LANDXN.LN IE000RN036E0 34,035.00 USD 738,334.87 21.693 ...
-
First Trust Global Funds PLC UK Regulatory Announcement: Net Asset Value(s)
LONDON--(BUSINESS WIRE)-- Funds Date TIDM ISIN Code Shares in Issue Currency Net Asset Value NAV/per Share First Trust Indxx Innovative Transaction & Process UCITS ETF 22.06.2026 LEGR LN IE00BF5DXP42 950,002.00 USD 51,709,112.21 54.431 ...
-
Computershare Trustees (Jersey) Limited UK Regulatory Announcement: Form 8.3
LONDON--(BUSINESS WIRE)-- FORM 8.3 PUBLIC OPENING POSITION DISCLOSURE/DEALING DISCLOSURE BY A PERSON WITH INTERESTS IN RELEVANT SECURITIES REPRESENTING 1% OR MORE Rule 8.3 of the Takeover Code (the “Code”) 1. KEY INFORMATION (a) Full name of discloser: Computershare Trustees (Jersey) Limited as trustee of the Schroders Employee Benefit Trust (b) Owner or controller of interests and short positions disclosed, if different from 1(a): The naming of nominee or vehicle companies is insufficient. Fo...