
")
")
 Ranked by Completed Foreclosures (Graphic: Business Wire)")
")
")
")
IRVINE, Calif.--(BUSINESS WIRE)--CoreLogic® (NYSE: CLGX), a leading global property information, analytics and data-enabled solutions provider, today released its December 2016 National Foreclosure Report which shows the foreclosure inventory declined by 30 percent and completed foreclosures declined by 40 percent compared with December 2015. The number of completed foreclosures nationwide decreased year over year from 36,000 in December 2015 to 21,000 in December 2016, representing a decrease of 82 percent from the peak of 118,336 in September 2010.
The foreclosure inventory represents the number of homes at some stage of the foreclosure process and completed foreclosures reflect the total number of homes lost to foreclosure. Since the financial crisis began in September 2008, there have been approximately 6.5 million completed foreclosures nationally, and since homeownership rates peaked in the second quarter of 2004, there have been approximately 8.6 million homes lost to foreclosure.
As of December 2016, the national foreclosure inventory included approximately 329,000, or 0.8 percent, of all homes with a mortgage compared with 467,000 homes, or 1.2 percent, in December 2015.
CoreLogic also reports that the number of mortgages in serious delinquency (defined as 90 days or more past due including loans in foreclosure or REO) declined by 19.4 percent from December 2015 to December 2016 with 1 million mortgages, or 2.6 percent, in serious delinquency, the lowest level since August 2007. The decline was geographically broad with year-over-year decreases in serious delinquency in 48 states and the District of Columbia.
“While the decline in serious delinquency has been geographically broad, some oil-producing markets have shown the effects of low oil prices on the housing market,” said Dr. Frank Nothaft, chief economist for CoreLogic. “Serious delinquency rates rose in Louisiana, Wyoming and North Dakota, reflecting the weakness in oil production.”
“Foreclosure and delinquency trends continue to head in the right direction powered principally by increasing employment levels, stringent underwriting standards and higher home prices over the past few years. We expect to see further declines in delinquency and foreclosure rates in 2017,” said Anand Nallathambi, president and CEO of CoreLogic. “As the foreclosure inventory diminishes, we must look ahead and tackle tight housing supply and growing affordability issues which are keeping many potential homebuyers, especially first-time buyers, on the sidelines.”
Additional December 2016 highlights:
- On a month-over-month basis, completed foreclosures declined by 8.1 percent to 21,000 in December 2016 from the 23,000 reported for November 2016.* As a basis of comparison, before the decline in the housing market in 2007, completed foreclosures averaged about 22,000 per month nationwide between 2000 and 2006.
- On a month-over-month basis, the December 2016 foreclosure inventory fell 1.9 percent compared with November 2016.
- The five states with the highest number of completed foreclosures in the 12 months ending in December 2016 were Florida (45,000), Michigan (30,000), Texas (24,000), Ohio (21,000) and California (19,000).These five states accounted for 36 percent of all completed foreclosures nationally.
- Four states and the District of Columbia had the lowest number of completed foreclosures in the 12 months ending in December 2016: North Dakota (182), the District of Columbia (254), West Virginia (312), Montana (630) and Alaska (668).
- Four states and the District of Columbia had the highest foreclosure inventory rate in December 2016: New Jersey (2.8 percent), New York (2.7 percent), Maine (1.8 percent), Hawaii (1.7 percent) and the District of Columbia (1.6 percent).
- The five states with the lowest foreclosure inventory rate in December 2016 were Colorado (0.2 percent), Minnesota (0.3 percent), Utah (0.3 percent), Arizona (0.3 percent) and California (0.3 percent).
*November 2016 data was revised. Revisions are standard, and to ensure accuracy CoreLogic incorporates newly released data to provide updated results.
|
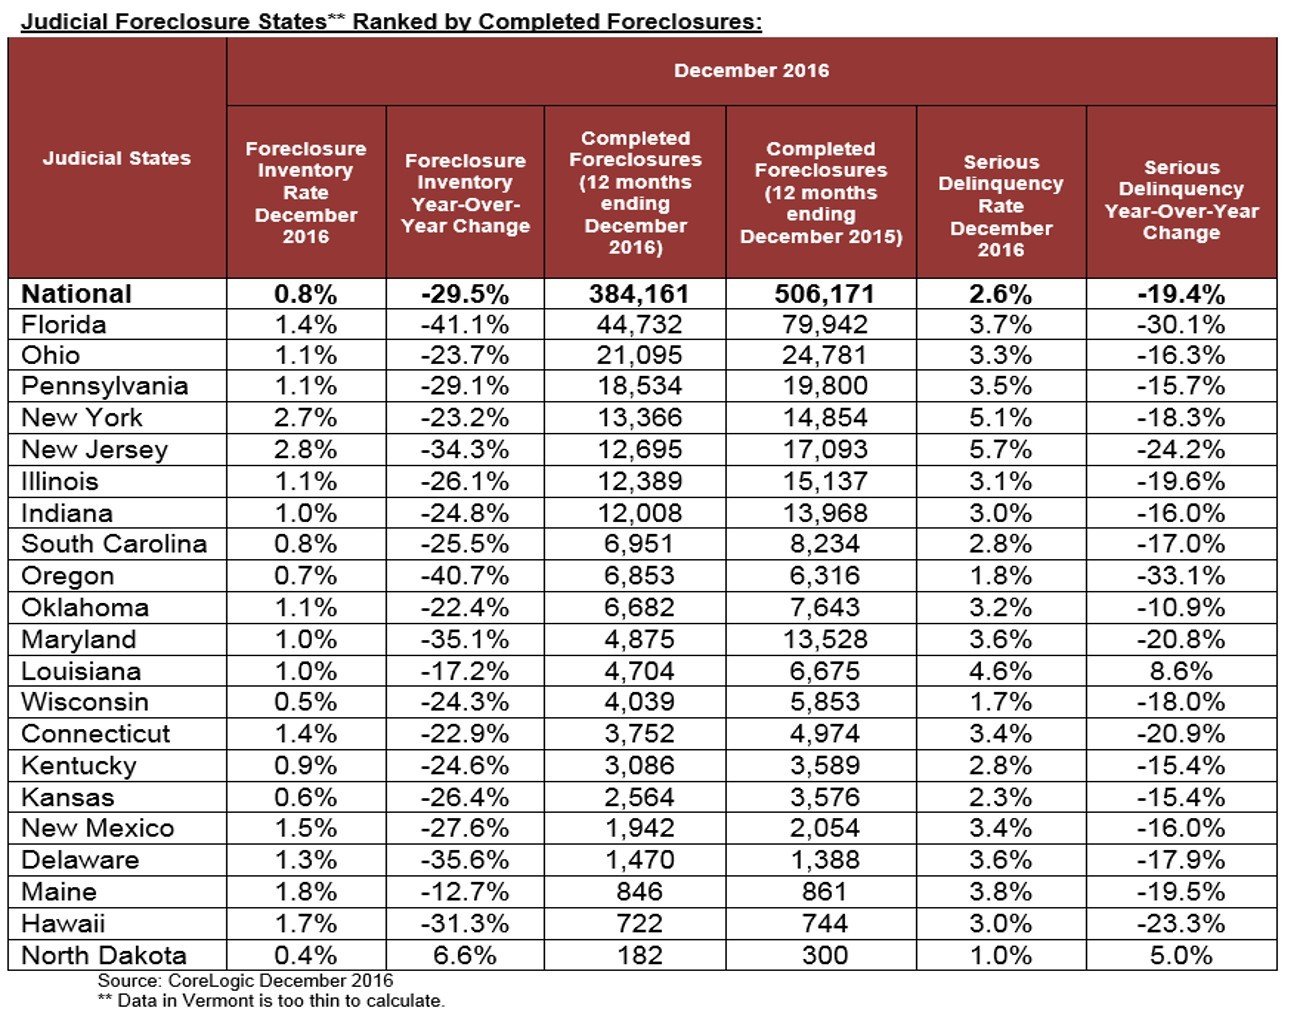
Judicial Foreclosure States** Ranked by Completed Foreclosures: |
||||||||||||
|
Judicial States |
December 2016 |
|||||||||||
|
Foreclosure Inventory Rate December 2016 |
Foreclosure Inventory Year-Over- Year Change |
Completed Foreclosures (12 months ending December 2016) |
Completed Foreclosures (12 months ending December 2015) |
Serious Delinquency Rate December 2016 |
Serious Delinquency Year-Over-Year Change |
|||||||
| National | 0.8% | -29.5% | 384,161 | 506,171 | 2.6% | -19.4% | ||||||
| Florida | 1.4% | -41.1% | 44,732 | 79,942 | 3.7% | -30.1% | ||||||
| Ohio | 1.1% | -23.7% | 21,095 | 24,781 | 3.3% | -16.3% | ||||||
| Pennsylvania | 1.1% | -29.1% | 18,534 | 19,800 | 3.5% | -15.7% | ||||||
| New York | 2.7% | -23.2% | 13,366 | 14,854 | 5.1% | -18.3% | ||||||
| New Jersey | 2.8% | -34.3% | 12,695 | 17,093 | 5.7% | -24.2% | ||||||
| Illinois | 1.1% | -26.1% | 12,389 | 15,137 | 3.1% | -19.6% | ||||||
| Indiana | 1.0% | -24.8% | 12,008 | 13,968 | 3.0% | -16.0% | ||||||
| South Carolina | 0.8% | -25.5% | 6,951 | 8,234 | 2.8% | -17.0% | ||||||
| Oregon | 0.7% | -40.7% | 6,853 | 6,316 | 1.8% | -33.1% | ||||||
| Oklahoma | 1.1% | -22.4% | 6,682 | 7,643 | 3.2% | -10.9% | ||||||
| Maryland | 1.0% | -35.1% | 4,875 | 13,528 | 3.6% | -20.8% | ||||||
| Louisiana | 1.0% | -17.2% | 4,704 | 6,675 | 4.6% | 8.6% | ||||||
| Wisconsin | 0.5% | -24.3% | 4,039 | 5,853 | 1.7% | -18.0% | ||||||
| Connecticut | 1.4% | -22.9% | 3,752 | 4,974 | 3.4% | -20.9% | ||||||
| Kentucky | 0.9% | -24.6% | 3,086 | 3,589 | 2.8% | -15.4% | ||||||
| Kansas | 0.6% | -26.4% | 2,564 | 3,576 | 2.3% | -15.4% | ||||||
| New Mexico | 1.5% | -27.6% | 1,942 | 2,054 | 3.4% | -16.0% | ||||||
| Delaware | 1.3% | -35.6% | 1,470 | 1,388 | 3.6% | -17.9% | ||||||
| Maine | 1.8% | -12.7% | 846 | 861 | 3.8% | -19.5% | ||||||
| Hawaii | 1.7% | -31.3% | 722 | 744 | 3.0% | -23.3% | ||||||
| North Dakota | 0.4% | 6.6% | 182 | 300 | 1.0% | 5.0% | ||||||
|
Source: CoreLogic December 2016 |
||||||||||||
|
** Data in Vermont is too thin to calculate. |
||||||||||||
|
Non-Judicial Foreclosure States*** Ranked by Completed Foreclosures: |
||||||||||||
| Non-Judicial States |
December 2016 |
|||||||||||
|
Foreclosure Inventory Rate December 2016 |
Foreclosure Inventory Year-Over- Year Change |
Completed Foreclosures (12 months ending December 2016) |
Completed Foreclosures (12 months ending December 2015) |
Serious Delinquency Rate December 2016 |
Serious Delinquency Year-Over- Year Change |
|||||||
| National | 0.8% | -29.5% | 384,161 | 506,171 | 2.6% | -19.4% | ||||||
| Michigan | 0.3% | -32.3% | 29,960 | 45,258 | 1.9% | -18.9% | ||||||
| Texas | 0.5% | -11.8% | 24,097 | 30,497 | 2.3% | -11.1% | ||||||
| California | 0.3% | -32.2% | 19,251 | 24,493 | 1.3% | -21.0% | ||||||
| Georgia | 0.5% | -20.4% | 18,790 | 24,113 | 2.8% | -15.3% | ||||||
| North Carolina | 0.5% | -27.4% | 12,596 | 16,784 | 2.5% | -14.8% | ||||||
| Tennessee | 0.4% | -26.3% | 11,195 | 14,336 | 2.8% | -16.2% | ||||||
| Virginia | 0.3% | -27.4% | 10,946 | 13,142 | 1.9% | -14.2% | ||||||
| Missouri | 0.5% | -26.9% | 10,334 | 11,508 | 2.2% | -16.2% | ||||||
| Washington | 0.6% | -42.1% | 9,727 | 11,163 | 1.6% | -30.5% | ||||||
| Alabama | 0.5% | -23.7% | 8,344 | 9,315 | 3.2% | -15.1% | ||||||
| Arizona | 0.3% | -26.4% | 8,294 | 10,379 | 1.4% | -16.2% | ||||||
| Massachusetts | 1.0% | -20.8% | 6,164 | 4,735 | 2.6% | -24.5% | ||||||
| Nevada | 1.0% | -34.0% | 5,760 | 6,575 | 2.9% | -26.1% | ||||||
| Arkansas | 0.6% | -36.5% | 4,216 | 4,832 | 3.1% | -15.4% | ||||||
| Minnesota | 0.3% | -32.2% | 3,722 | 5,847 | 1.4% | -19.9% | ||||||
| Colorado | 0.2% | -40.2% | 3,043 | 4,484 | 1.0% | -24.1% | ||||||
| Iowa | 0.7% | -29.0% | 2,675 | 3,723 | 1.9% | -15.5% | ||||||
| Idaho | 0.4% | -38.6% | 2,155 | 2,647 | 1.3% | -24.0% | ||||||
| Utah | 0.3% | -30.0% | 1,788 | 2,271 | 1.2% | -21.6% | ||||||
| Rhode Island | 1.2% | -31.8% | 1,579 | 1,293 | 3.4% | -25.9% | ||||||
| New Hampshire | 0.5% | -30.4% | 1,369 | 1,739 | 1.7% | -21.9% | ||||||
| Nebraska | 0.4% | -19.1% | 1,156 | 1,488 | 1.5% | -16.2% | ||||||
| Mississippi | 0.8% | -14.1% | 829 | 985 | 4.3% | -12.9% | ||||||
| Wyoming | 0.4% | -23.8% | 766 | 667 | 2.0% | 13.7% | ||||||
| Alaska | 0.3% | -6.1% | 668 | 678 | 1.1% | -3.5% | ||||||
| Montana | 0.4% | -19.8% | 630 | 762 | 1.2% | -18.8% | ||||||
| West Virginia | 0.7% | 0.3% | 312 | 597 | 2.9% | -4.7% | ||||||
| District of Columbia | 1.6% | -28.0% | 254 | 149 | 3.1% | -15.6% | ||||||
|
Source: CoreLogic December 2016 |
||||||||||||
|
*** Data in South Dakota is too thin to calculate. |
||||||||||||
|
Foreclosure Data for Select Core Based Statistical Areas (CBSAs) Ranked by Completed Foreclosures: |
||||||||||||
|
CBSA |
December 2016 | |||||||||||
|
Foreclosure Inventory Rate December 2016 |
Foreclosure Inventory Year-Over- Year Change |
Completed Foreclosures (12 months ending December 2016) |
Completed Foreclosures (12 months ending December 2015) |
Serious Delinquency Rate December 2016 |
Serious Delinquency Year-Over- Year Change |
|||||||
| New York-Jersey City-White Plains, NY-NJ | 2.5% | -27.5% | 7,043 | 8,303 | 4.7% | -21.5% | ||||||
| Chicago-Naperville-Arlington Heights, IL | 1.1% | -29.1% | 5,544 | 6,555 | 3.4% | -22.3% | ||||||
| Las Vegas-Henderson-Paradise, NV | 1.1% | -33.8% | 4,608 | 4,958 | 3.2% | -26.0% | ||||||
| Houston-The Woodlands-Sugar Land, TX | 0.6% | 8.0% | 4,566 | 6,325 | 2.4% | -4.6% | ||||||
| Miami-Miami Beach-Kendall, FL | 2.0% | -36.1% | 4,558 | 7,474 | 5.1% | -29.2% | ||||||
| Washington-Arlington-Alexandria, DC-VA-MD-WV | 0.7% | -29.4% | 3,446 | 4,928 | 2.4% | -16.4% | ||||||
| Los Angeles-Long Beach-Glendale, CA | 0.3% | -30.1% | 3,346 | 4,148 | 1.4% | -21.4% | ||||||
| Boston, MA | 0.9% | -23.2% | 1,323 | 1,074 | 2.4% | -25.5% | ||||||
| Denver-Aurora-Lakewood, CO | 0.2% | -39.3% | 715 | 1,399 | 0.8% | -22.6% | ||||||
| San Francisco-Redwood City-South San Francisco, CA | 0.1% | -34.9% | 139 | 181 | 0.5% | -25.1% | ||||||
| Source: CoreLogic December 2016 | ||||||||||||
For ongoing housing trends and data, visit the CoreLogic Insights Blog: www.corelogic.com/blog.
Methodology
The data in this report represents foreclosure activity reported through December 2016.
This report separates state data into judicial versus non-judicial foreclosure state categories. In judicial foreclosure states, lenders must provide evidence to the courts of delinquency in order to move a borrower into foreclosure. In non-judicial foreclosure states, lenders can issue notices of default directly to the borrower without court intervention. This is an important distinction since judicial states, as a rule, have longer foreclosure timelines, thus affecting foreclosure statistics.
A completed foreclosure occurs when a property is auctioned and results in the purchase of the home at auction by either a third party, such as an investor, or by the lender. If the home is purchased by the lender, it is moved into the lender’s real estate-owned (REO) inventory. In “foreclosure by advertisement” states, a redemption period begins after the auction and runs for a statutory period, e.g., six months. During that period, the borrower may regain the foreclosed home by paying all amounts due as calculated under the statute. For purposes of this Foreclosure Report, because so few homes are actually redeemed following an auction, it is assumed that the foreclosure process ends in “foreclosure by advertisement” states at the completion of the auction.
The foreclosure inventory represents the number and share of mortgaged homes that have been placed into the process of foreclosure by the mortgage servicer. Mortgage servicers start the foreclosure process when the mortgage reaches a specific level of serious delinquency as dictated by the investor for the mortgage loan. Once a foreclosure is “started,” and absent the borrower paying all amounts necessary to halt the foreclosure, the home remains in foreclosure until the completed foreclosure results in the sale to a third party at auction or the home enters the lender’s REO inventory. The data in this report accounts for only first liens against a property and does not include secondary liens. The foreclosure inventory is measured only against homes that have an outstanding mortgage. Generally, homes with no mortgage liens are not subject to foreclosure and are, therefore, excluded from the analysis. Approximately one-third of homes nationally are owned outright and do not have a mortgage. CoreLogic has approximately 85 percent coverage of U.S. foreclosure data.
Source: CoreLogic
The data provided is for use only by the primary recipient or the primary recipient's publication or broadcast. This data may not be re-sold, republished or licensed to any other source, including publications and sources owned by the primary recipient's parent company without prior written permission from CoreLogic. Any CoreLogic data used for publication or broadcast, in whole or in part, must be sourced as coming from CoreLogic, a data and analytics company. For use with broadcast or web content, the citation must directly accompany first reference of the data. If the data is illustrated with maps, charts, graphs or other visual elements, the CoreLogic logo must be included on screen or website. For questions, analysis or interpretation of the data, contact Lori Guyton at lguyton@cvic.com or Bill Campbell at bill@campbelllewis.com. Data provided may not be modified without the prior written permission of CoreLogic. Do not use the data in any unlawful manner. This data is compiled from public records, contributory databases and proprietary analytics, and its accuracy is dependent upon these sources.
About CoreLogic
CoreLogic (NYSE: CLGX) is a leading global property information, analytics and data-enabled solutions provider. The company’s combined data from public, contributory and proprietary sources includes over 4.5 billion records spanning more than 50 years, providing detailed coverage of property, mortgages and other encumbrances, consumer credit, tenancy, location, hazard risk and related performance information. The markets CoreLogic serves include real estate and mortgage finance, insurance, capital markets, and the public sector. CoreLogic delivers value to clients through unique data, analytics, workflow technology, advisory and managed services. Clients rely on CoreLogic to help identify and manage growth opportunities, improve performance and mitigate risk. Headquartered in Irvine, Calif., CoreLogic operates in North America, Western Europe and Asia Pacific. For more information, please visit www.corelogic.com.
CORELOGIC and the CoreLogic logo are trademarks of CoreLogic, Inc. and/or its subsidiaries.