

Newsroom
Sorted by: Latest
-
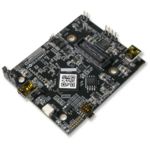
EPC Expands the Offering of 100 V Integrated GaN Power Stages Optimized for Motor Drives With Improved Control and Protection
EL SEGUNDO, Calif.--(BUSINESS WIRE)--Efficient Power Conversion (EPC), a leader in enhancement-mode gallium nitride (eGaN®) power devices, has introduced a new generation of 100 V integrated GaN power-stage ICs - EPC23108, EPC23109, EPC23110 and EPC23111 - targeting high-performance motion and power systems such as humanoid robots, drones, and other compact battery-powered platforms. The devices are designed to simplify implementation and improve operational robustness in real-world environment...
-
Fixed Summit Unveils 2026 Lineup of Speakers & Events
DALLAS--(BUSINESS WIRE)--Fixed Summit, the event built exclusively for multifamily maintenance and facilities professionals, today announced expanded programming for the 2026 event, April 27–29 at Hyatt Regency Lost Pines Resort near Austin. The lineup features OSHA-certified safety training, live equipment demos, peer-led breakout sessions and the return of the FXD Built Different challenge — all designed by and for the technicians, supervisors, directors and operations leaders that keep prope...
-
C1 Fund Inc. Announces Form N-CSR Filing Update
PALO ALTO, Calif.--(BUSINESS WIRE)--C1 Fund Inc. (NYSE: CFND) announced today that it is unable to complete and file its Annual Report on Form N-CSR and transmit its annual report to shareholders for the period ended December 31, 2025 within the prescribed time period without unreasonable effort or expense. The Fund has received notice from the New York Stock Exchange in connection with the late filing, which has no immediate effect on the listing of the Fund’s common stock on the NYSE. As prev...
-
Bank of Hawai‘i Corporation Conference Call to Discuss First Quarter 2026 Financial Results and Board Declares Quarterly Preferred Stock Dividends
HONOLULU--(BUSINESS WIRE)--Bank of Hawai‘i Corporation (NYSE: BOH) (the “Company”) will release first quarter 2026 financial results on Monday, April 20, 2026 before the market opens and hold its quarterly conference call at 2:00 p.m. Eastern Time (8:00 a.m. Hawai‘i Time) on the same day. The live call, including a slide presentation, will be accessible on the investor relations link of the Company's website, www.boh.com. The webcast link is https://register-conf.media-server.com/register/BI42d...

-
CORRECTING and REPLACING ATL Medical Integrates OMNIVISION’s OVMed® OH0131 Image Signal Processor into Its PREVOYANCE® Medical Imaging System
SANTA CLARA, Calif. & SPRINGVILLE, Utah--(BUSINESS WIRE)--In the second paragraph, first sentence following the bulleted list of the release issued on March 31, 2026: ISO 13585 should now read ISO 13485. The updated release reads: ATL MEDICAL INTEGRATES OMNIVISION’S OVMED® OH0131 IMAGE SIGNAL PROCESSOR INTO ITS PREVOYANCE® MEDICAL IMAGING SYSTEM The OVMed® ISP OH0131 features advanced image algorithms to optimize brightness, contrast, saturation, hue and sharpness, along with advanced noise red...
-
Xeris Announces Inducement Grants Under NASDAQ Listing Rule 5635(c)(4)
CHICAGO--(BUSINESS WIRE)--Xeris Biopharma Holdings, Inc. (Nasdaq: XERS), a fast-growing biopharmaceutical company committed to improving patient lives by developing and commercializing innovative products across a range of therapies, today announced that on April 1, 2026, the Compensation Committee of Xeris’ Board of Directors granted restricted stock units for an aggregate of 304,975 shares of its common stock to 90 new employee(s) under Xeris’ Inducement Equity Plan. Xeris’ Inducement Equity...
-
Shift4 Announces Fourth Dividend Date for Mandatory Convertible Preferred Stock
CENTER VALLEY, Pa.--(BUSINESS WIRE)--Shift4 Payments, Inc. (“Shift4” or the “Company”) (NYSE: FOUR), announced today, in connection with the 10,000,000 shares of 6% Series A Mandatory Convertible Preferred Stock issued on May 5, 2025, consistent with the terms laid out in the offering, the Board of Directors has declared a dividend of $1.50 per share to be paid in cash on May 1, 2026 to holders of record as of the close of business on April 15, 2026. Subject to the terms of the Mandatory Conver...
-
Kinsale Capital Group Announces First Quarter 2026 Earnings Release Date and Conference Call
RICHMOND, Va.--(BUSINESS WIRE)--Kinsale Capital Group Announces First Quarter 2026 Earnings Release Date and Conference Call...
-
John Marshall Bancorp, Inc. Announces First Quarter 2026 Earnings Release Date
RESTON, Va.--(BUSINESS WIRE)--John Marshall Bancorp, Inc. (Nasdaq: JMSB) today announced that it expects to issue first quarter 2026 earnings before the market opens on Wednesday, April 29, 2026. About John Marshall Bancorp, Inc.: John Marshall Bancorp, Inc. is the bank holding company for John Marshall Bank. The Bank is headquartered in Reston, Virginia with eight full-service branches located in Alexandria, Arlington, Loudoun, Prince William, Reston, and Tysons, Virginia, as well as Rockville...
-
KBRA Assigns Preliminary Ratings to OBX 2026-AHC1 Trust
NEW YORK--(BUSINESS WIRE)--KBRA assigns preliminary ratings to 62 classes of mortgage pass-through notes from OBX 2026-AHC1 Trust, a prime agency-eligible RMBS transaction sponsored by Onslow Bay Financial LLC, that is fully originated and serviced by AmeriHome Mortgage Company, LLC (AmeriHome). This transaction is comprised of 692 residential mortgages with an aggregate unpaid principal balance (UPB) of approximately $349.3 million as of the April 1, 2026 cut-off date. The underlying collatera...