

Newsroom
Sorted by: Latest
-
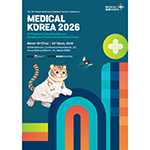
2026年Medical Korea大会将重点展示AI赋能的全球保健与医疗观光
韩国首尔--(BUSINESS WIRE)--(美国商业资讯)-- 2026年Medical Korea大会暨第16届全球保健与医疗观光大会将于2026年3月19-22日在首尔国际会展中心(COEX)举行。本次展会由韩国保健福祉部(MOHW)主办,由韩国保健产业振兴院(KHIDI)主管,将汇聚全球医疗保健领域领导者、政策制定者和行业专家,共同探讨AI赋能的医疗保健和跨境医疗服务的未来。 自2010年创办以来,Medical Korea一直致力于为全球医疗创新和医疗观光领域的对话搭建平台。今年的大会以“AI赋能全球医疗:拉近未来与世界的距离(AI-Powered Global Healthcare: Bringing the Future and the World Closer)”为主题,重点探讨AI将如何影响医疗服务、数字化转型和国际医疗合作。 大会日程包括开幕式、八场专题研讨会、商务洽谈会、政府间会谈、展览、考察之旅以及Medical Korea晚宴。 在开幕式上,韩国保健福祉部医疗产业政策局局长Eun-Young Jung和Marx Advisory首席执行官Edward Mar...
-
Techtronic Industries registra un desempeño sólido en 2025
HONG KONG--(BUSINESS WIRE)--Techtronic Industries Co. Ltd. (“TTI” o la “compañía”) (código bursátil: HK:0669; símbolo ADR: TTNDY), empresa global de herramientas eléctricas inalámbricas, equipos eléctricos para exteriores y soluciones de cuidado y limpieza de suelos, se complace en anunciar los resultados consolidados auditados de la compañía, y de sus subsidiarias, correspondientes al ejercicio finalizado el 31 de diciembre de 2025. TTI registró ventas récord de USD 15 300 millones en 2025, co...
-
Techtronic Industries registra ottimi risultati nel 2025
HONG KONG--(BUSINESS WIRE)--Techtronic Industries Co. Ltd. ("TTI" o la "Società") (codice di borsa: HK:0669, simbolo ADR: TTNDY), azienda globale produttrice di utensili elettrici a batteria, attrezzature elettriche per esterni e prodotti per la pulizia e la cura dei pavimenti, è lieta di annunciare i risultati consolidati verificati della Società e delle sue controllate per l'anno conclusosi il 31 dicembre 2025. TTI ha registrato un fatturato record di 15,3 miliardi di dollari nel 2025, con un...
-
Techtronic Industries levert robuuste prestaties in 2025
HONGKONG--(BUSINESS WIRE)--Techtronic Industries Co. Ltd. (“TTI” of het “Bedrijf”) (beurscode: HK:0669, ADR-symbool: TTNDY), het internationale bedrijf gespecialiseerd in draadloos elektrisch gereedschap, apparatuur voor gebruik buitenshuis, vloerreiniging en reiniging, maakt met genoegen de gecontroleerde geconsolideerde resultaten bekend van het Bedrijf en haar dochterondernemingen voor het jaar dat op 31 december 2025 afliep. TTI behaalde een recordomzet van US$15,3 miljard in 2025, en steeg...
-
Techtronic Industries erzielt 2025 solide Ergebnisse
HONGKONG--(BUSINESS WIRE)--Techtronic Industries Co. Ltd. („TTI” oder das „Unternehmen”) (Aktiencode: HK:0669, ADR-Symbol: TTNDY), ein weltweit tätiges Unternehmen für kabellose Elektrowerkzeuge, Outdoor-Motorgeräte sowie Bodenpflege- und Reinigungsgeräte, gibt die geprüften konsolidierten Ergebnisse des Unternehmens und seiner Tochtergesellschaften für das am 31. Dezember 2025 endende Geschäftsjahr bekannt. TTI erzielte 2025 einen Rekordumsatz von 15,3 Milliarden US-Dollar, was einem Wachstum...
-
Techtronic Industries affiche une solide performance en 2025
HONG KONG--(BUSINESS WIRE)--Techtronic Industries Co. Ltd. (« TTI » ou la « société ») (code boursier : HK:0669, symbole ADR : TTNDY), une société mondiale d'outils électriques sans fil, d'équipements électriques d'extérieur, d'entretien des sols et de nettoyage, est heureux d'annoncer les résultats consolidés audités de la société et de ses filiales pour l'exercice clos le 31 décembre 2025. TTI a réalisé des ventes record de 15,3 milliards USD en 2025, en croissance de 4,4% sur une base déclar...
-
Flexitech entscheidet sich für Rimini Street, um die Lebensdauer seines SAP ECC zu verlängern, die Compliance zu beschleunigen und Innovationen zu finanzieren
LAS VEGAS--(BUSINESS WIRE)--Rimini Street, Inc. (Nasdaq: RMNI), das Software-Support- und Agentic AI ERP-Unternehmen™ und führender Drittanbieter von Support für Oracle-, SAP- und VMware-Software, gab heute bekannt, dass Flexitech, ein französischer Hersteller von Brems- und Kühlschlauchlösungen für die globale Automobilindustrie, sich für Rimini Support™ for SAP entschieden hat, um die Sicherheit zu erhöhen, die Compliance-Bereitschaft zu beschleunigen und Budget für Innovationen freizusetzen....
-
Propulsé par son succès aux États-Unis, GEEK BAR lance SPARK pour ouvrir une nouvelle ère en Europe
SHENZHEN, China--(BUSINESS WIRE)--GEEK BAR a annoncé aujourd'hui son retour officiel sur le marché européen avec le lancement de GEEK BAR SPARK, un système de pods de nouvelle génération conçu pour offrir l’expérience unique de GEEK BAR dans un format plus durable et conforme aux régulations. Précédemment reconnu en Europe pour ses saveurs distinctives et son savoir-faire de haute qualité, GEEK BAR entame désormais un nouveau chapitre, ancré dans la responsabilité, la transparence et un engagem...
-
Angetrieben durch den Erfolg in den USA: GEEK BAR startet SPARK und leitet eine neue Ära in Europa ein
SHENZHEN, China--(BUSINESS WIRE)--GEEK BAR hat heute seine offizielle Rückkehr auf den europäischen Markt mit der Einführung des GEEK BAR SPARK angekündigt, einem System der nächsten Generation, das das charakteristische GEEK BAR-Erlebnis durch ein nachhaltigeres und regulatorisch konformes Format bietet. Früher in Europa für seine markanten Geschmacksrichtungen und hochwertige Verarbeitung bekannt, tritt GEEK BAR nun in ein neues Kapitel ein, das auf Verantwortung, Transparenz und einer langfr...
-
Fueled by U.S. Success, GEEK BAR Launches SPARK to Lead a New Era in Europe
SHENZHEN, China--(BUSINESS WIRE)--GEEK BAR today announced its official return to the European market with the launch of GEEK BAR SPARK, a new-generation pod system designed to deliver the signature GEEK BAR experience through a more sustainable and regulation-aligned format. Previously recognized in Europe for its distinctive flavors and high-quality craftsmanship, GEEK BAR now enters a renewed chapter rooted in responsibility, transparency, and long-term commitment to the region. The brand ma...