Newsroom
Sorted by: Latest
-
First Trust Global Funds PLC UK Regulatory Announcement: Net Asset Value(s)
LONDON--(BUSINESS WIRE)-- Funds Date TIDM ISIN Code Shares in Issue Currency Net Asset Value NAV/per Share First Trust NYSE Arca Biotechnology UCITS ETF 14.07.2026 FBTU.LN IE00BL0L0H60 425,002.00 USD 12,799,138.39 30.115 ...
-
Travel + Leisure Co. Adds Premier Resort Destinations and Expands Owner Base by Over 10% with the Acquisitions of Yes& Vacations and Spinnaker Resorts
ORLANDO, Fla.--(BUSINESS WIRE)--Travel + Leisure Co. (NYSE: TNL), a leading leisure travel company, today announced the closing of the acquisition of Yes& Vacations and, separately, entering into a definitive agreement to acquire Spinnaker Resorts, for a combined upfront purchase price of $343 million, subject to customary adjustments and contingent performance-based payments of up to $10 million. The Spinnaker Resorts acquisition is expected to close in the third quarter of 2026, subject t...
-
Tenon Expands Marketing Automation into the ServiceNow AI Platform, Unifying Customer Engagement Across the Enterprise
INDIANAPOLIS--(BUSINESS WIRE)--ServiceNow is a global leader in customer service, field service, sales, and operations, delivering AI-powered experiences on a single, unified CRM platform. By partnering with Tenon, organizations can now extend omnichannel marketing automation and AI-powered engagement within the same platform managing their end-to-end customer experience. By connecting marketing to the same customer data, workflows, and AI that powers the rest of the business, organizations can...

-
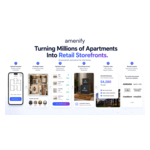
Amenify Unveils 3D Spaces, Turning Millions of Apartments Into Retail Storefronts
SAN FRANCISCO--(BUSINESS WIRE)--Amenify, the leading resident commerce platform connecting renters, home services, and merchants, today announced the launch of 3D Spaces, a new, AI-powered design and retail experience that lets tenants visualize and furnish their actual spaces before move-in, while creating a new retail channel for home brands to reach high-intent consumers at scale. 3D Spaces turns a resident’s real floor plan into a digital, shoppable 3D environment by allowing them to: Walk...
-
Acadian Asset Management Inc. to Report Financial and Operating Results for the Second Quarter Ended June 30, 2026
BOSTON--(BUSINESS WIRE)--Acadian Asset Management Inc. (NYSE: AAMI) will announce its financial and operating results for the second quarter ended June 30, 2026, on Thursday, July 30, 2026. The Company will announce its results through a press release and related slide presentation at 7:30 a.m. Eastern Time and will hold a conference call and simultaneous webcast to discuss the results at 11:00 a.m. Eastern Time. To listen to the call or view the webcast, participants should: Dial-in Local...
-
Nebius introduces business model to scale AI cloud globally through infrastructure partnerships
AMSTERDAM--(BUSINESS WIRE)--Nebius (Nasdaq: NBIS), the AI cloud company, today announced a new business model that lets infrastructure partners deploy Nebius’s full-stack AI cloud platform in their own AI data centers. The model brings additional capacity to Nebius customers, and expands the availability of value-added AI compute globally at a time when demand continues to outstrip supply. Under the model, partners finance and own the infrastructure and hardware, and operate the data centers. N...

-
Kairos Pharma Reports Breakthrough Interim Safety Data in Phase 1 Trial of ENV-105 in EGFR-Mutated Lung Cancer Patients — Targeting a $10 Billion Drug Resistance Market
LOS ANGELES--(BUSINESS WIRE)--Kairos Pharma, Ltd. (NYSE American: KAPA), a clinical-stage biopharmaceutical company addressing drug resistance in cancer, today announced compelling interim safety data from its ongoing Phase 1 clinical trial evaluating ENV-105 (carotuximab) in combination with osimertinib (AstraZeneca's Tagrisso®) in patients with advanced EGFR-mutated non-small cell lung cancer (NSCLC). The data represent a pivotal milestone in Kairos Pharma's lead program: resensitizing patien...
-
Zoetis Launches Lenivia® (izenivetmab injection) in Canada and the European Union
PARSIPPANY, N.J.--(BUSINESS WIRE)--Zoetis Inc. (NYSE: ZTS) today announced that it has recently launched Lenivia® (izenivetmab injection) in Canada and the European Union (EU) member states – a new long-acting monoclonal antibody (mAb) therapy designed to deliver up to three months of osteoarthritis (OA) pain management with a single subcutaneous injection. Backed by a decade of science and research, Lenivia demonstrated a sustained reduction in pain in a pivotal nine-month European field study...
-
LSB Industries, Inc. Schedules 2026 Second Quarter Results Release for Wednesday, July 29th and Conference Call for Thursday, July 30th
OKLAHOMA CITY--(BUSINESS WIRE)--LSB Industries, Inc. (“LSB”) (NYSE: LXU), today announced that it will release its financial results for the second quarter ended June 30, 2026 on July 29, 2026 after the close of the stock market.LSB’s management will host a conference call on Thursday, July 30, 2026 at 10:00 am ET / 9:00 am CT to discuss these results. Participating in the call will be Chairman & Chief Executive Officer, Mark Behrman, Executive Vice President & Chief Financial Officer, C...
-
MVB Financial Sets Date for Second Quarter 2026 Earnings Release and Conference Call
FAIRMONT, W.Va.--(BUSINESS WIRE)--MVB Financial Corp. will release its second quarter 2026 financial results after market close on Tuesday, July 28, 2026....