

Newsroom
Sorted by: Latest
-
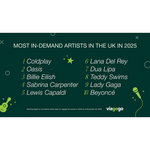
The Most Iconic Moments From Lily Allen, Lewis Capaldi, Katy Perry and Drake Revealed in Year in Live Experiences Report
LONDON--(BUSINESS WIRE)--From Lily Allen creating the ultimate diss album, Lewis Capaldi beating Drake and Kendrick, to Katy Perry’s space adventure impacting her ticket sales - a new report unlocks fans favourite moments in live music for this year. Leading ticket marketplace viagogo has released its third annual Year in Live Experiences Report – spotlighting the UK’s hottest moments in live music for 2025. Coldplay took first place as the top selling artist in the UK on viagogo, followed by O...
-
Pimicotinib Approved as Systemic Treatment in China for Tenosynovial Giant Cell Tumor
DARMSTADT, Germany--(BUSINESS WIRE)--Pimicotinib Approved as Systemic Treatment in China for Tenosynovial Giant Cell Tumor...
-
KKR Launches European Rail Leasing Platform with Green Mobility Partners
FRANKFURT, Germany--(BUSINESS WIRE)--Green Mobility Partners (“GMP”), a Vienna-based electric locomotive leasing company, and KKR, a leading global investment firm, today announced a strategic partnership to create a leading European rail leasing platform to meet growing demand for sustainable rail infrastructure across Europe. GMP provides electric locomotives to freight and passenger rail operators across Continental Europe, supporting the sector's transition toward electrification. Founded i...
-
Pimicotinib Approved as Systemic Treatment in China for Tenosynovial Giant Cell Tumor
DARMSTADT, Germany--(BUSINESS WIRE)--Pimicotinib Approved as Systemic Treatment in China for Tenosynovial Giant Cell Tumor...
-
Hisense se suma al consorcio de patentes HEVC Advance
BOSTON--(BUSINESS WIRE)--Access Advance LLC, líder mundial en licencias de consorcios de patentes de códecs de vídeo, ha anunciado hoy que Hisense Group Holdings Co., Ltd. se ha incorporado al consorcio de patentes HEVC Advance en calidad de licenciatario. Hisense se suma a las incorporaciones recientes al consorcio de patentes de Access Advance, entre las que se destacan Xiaomi, MSI y Transsion, y amplía sus relaciones con Huawei, HP y Sharp. Hisense, con sede en Qingdao (China), es uno de los...
-
Hisense voegt zich bij HEVC Advance Patent Pool
BOSTON--(BUSINESS WIRE)--Access Advance LLC, de wereldwijde leider in licentieverlening voor patentpools voor videocodecs, heeft vandaag aangekondigd dat Hisense Group Holdings Co., Ltd. zich bij de HEVC Advance Patent Pool heeft gevoegd als licentienemer. Hisense voegt zich bij de recente toevoegingen aan de patentpools van Access Advance, waaronder Xiaomi, MSI, Transsion, en de uitgebreide samenwerkingen met Huawei, HP en Sharp. Hisense, met hoofdkantoor in Qingdao, China, is een van 's werel...
-
Incyte Japan Announces Approval of Minjuvi® (tafasitamab) in Combination with Rituximab and Lenalidomide for the Treatment of Relapsed or Refractory Follicular Lymphoma
TOKYO--(BUSINESS WIRE)--Incyte Japan Announces Approval of Minjuvi® (tafasitamab) in Combination with Rituximab and Lenalidomide for Relapsed/Refractory Follicular Lymphoma...
-
Incyte Japan Announces Approval of Zynyz® (retifanlimab) for the First-Line Treatment of Advanced Anal Cancer
TOKYO--(BUSINESS WIRE)--Incyte Japan Announces Approval of Zynyz® (retifanlimab) for the First-Line Treatment of Advanced Anal Cancer...
-
DESTINY-Endometrial02 Phase 3 Trial of ENHERTU® Initiated as Adjuvant Therapy in Patients with HER2 Expressing Endometrial Cancer
TOKYO & BASKING RIDGE, N.J.--(BUSINESS WIRE)--DESTINY-Endometrial02 Phase 3 Trial of ENHERTU® Initiated as Adjuvant Therapy in Patients with HER2 Expressing Endometrial Cancer...
-
Rapport de couverture analyste de GBC AG sur Mexedia S.p.A. Società Benefit finalisé et publié
ROME--(BUSINESS WIRE)--Regulatory News: Mexedia S.p.A. Società Benefit (Euronext Growth Paris : ALMEX, ISIN IT0005450819) (« Mexedia » ou la « Société ») informe que le rapport de couverture analyste préparé par GBC AG – l’un des principaux cabinets indépendants de recherche financière en Allemagne –, élaboré dans le cadre d’une issuer-sponsored research, a été finalisé et est désormais publiquement disponible. Ce rapport fait suite à la reprise de la couverture analyste par GBC AG, précédemmen...