
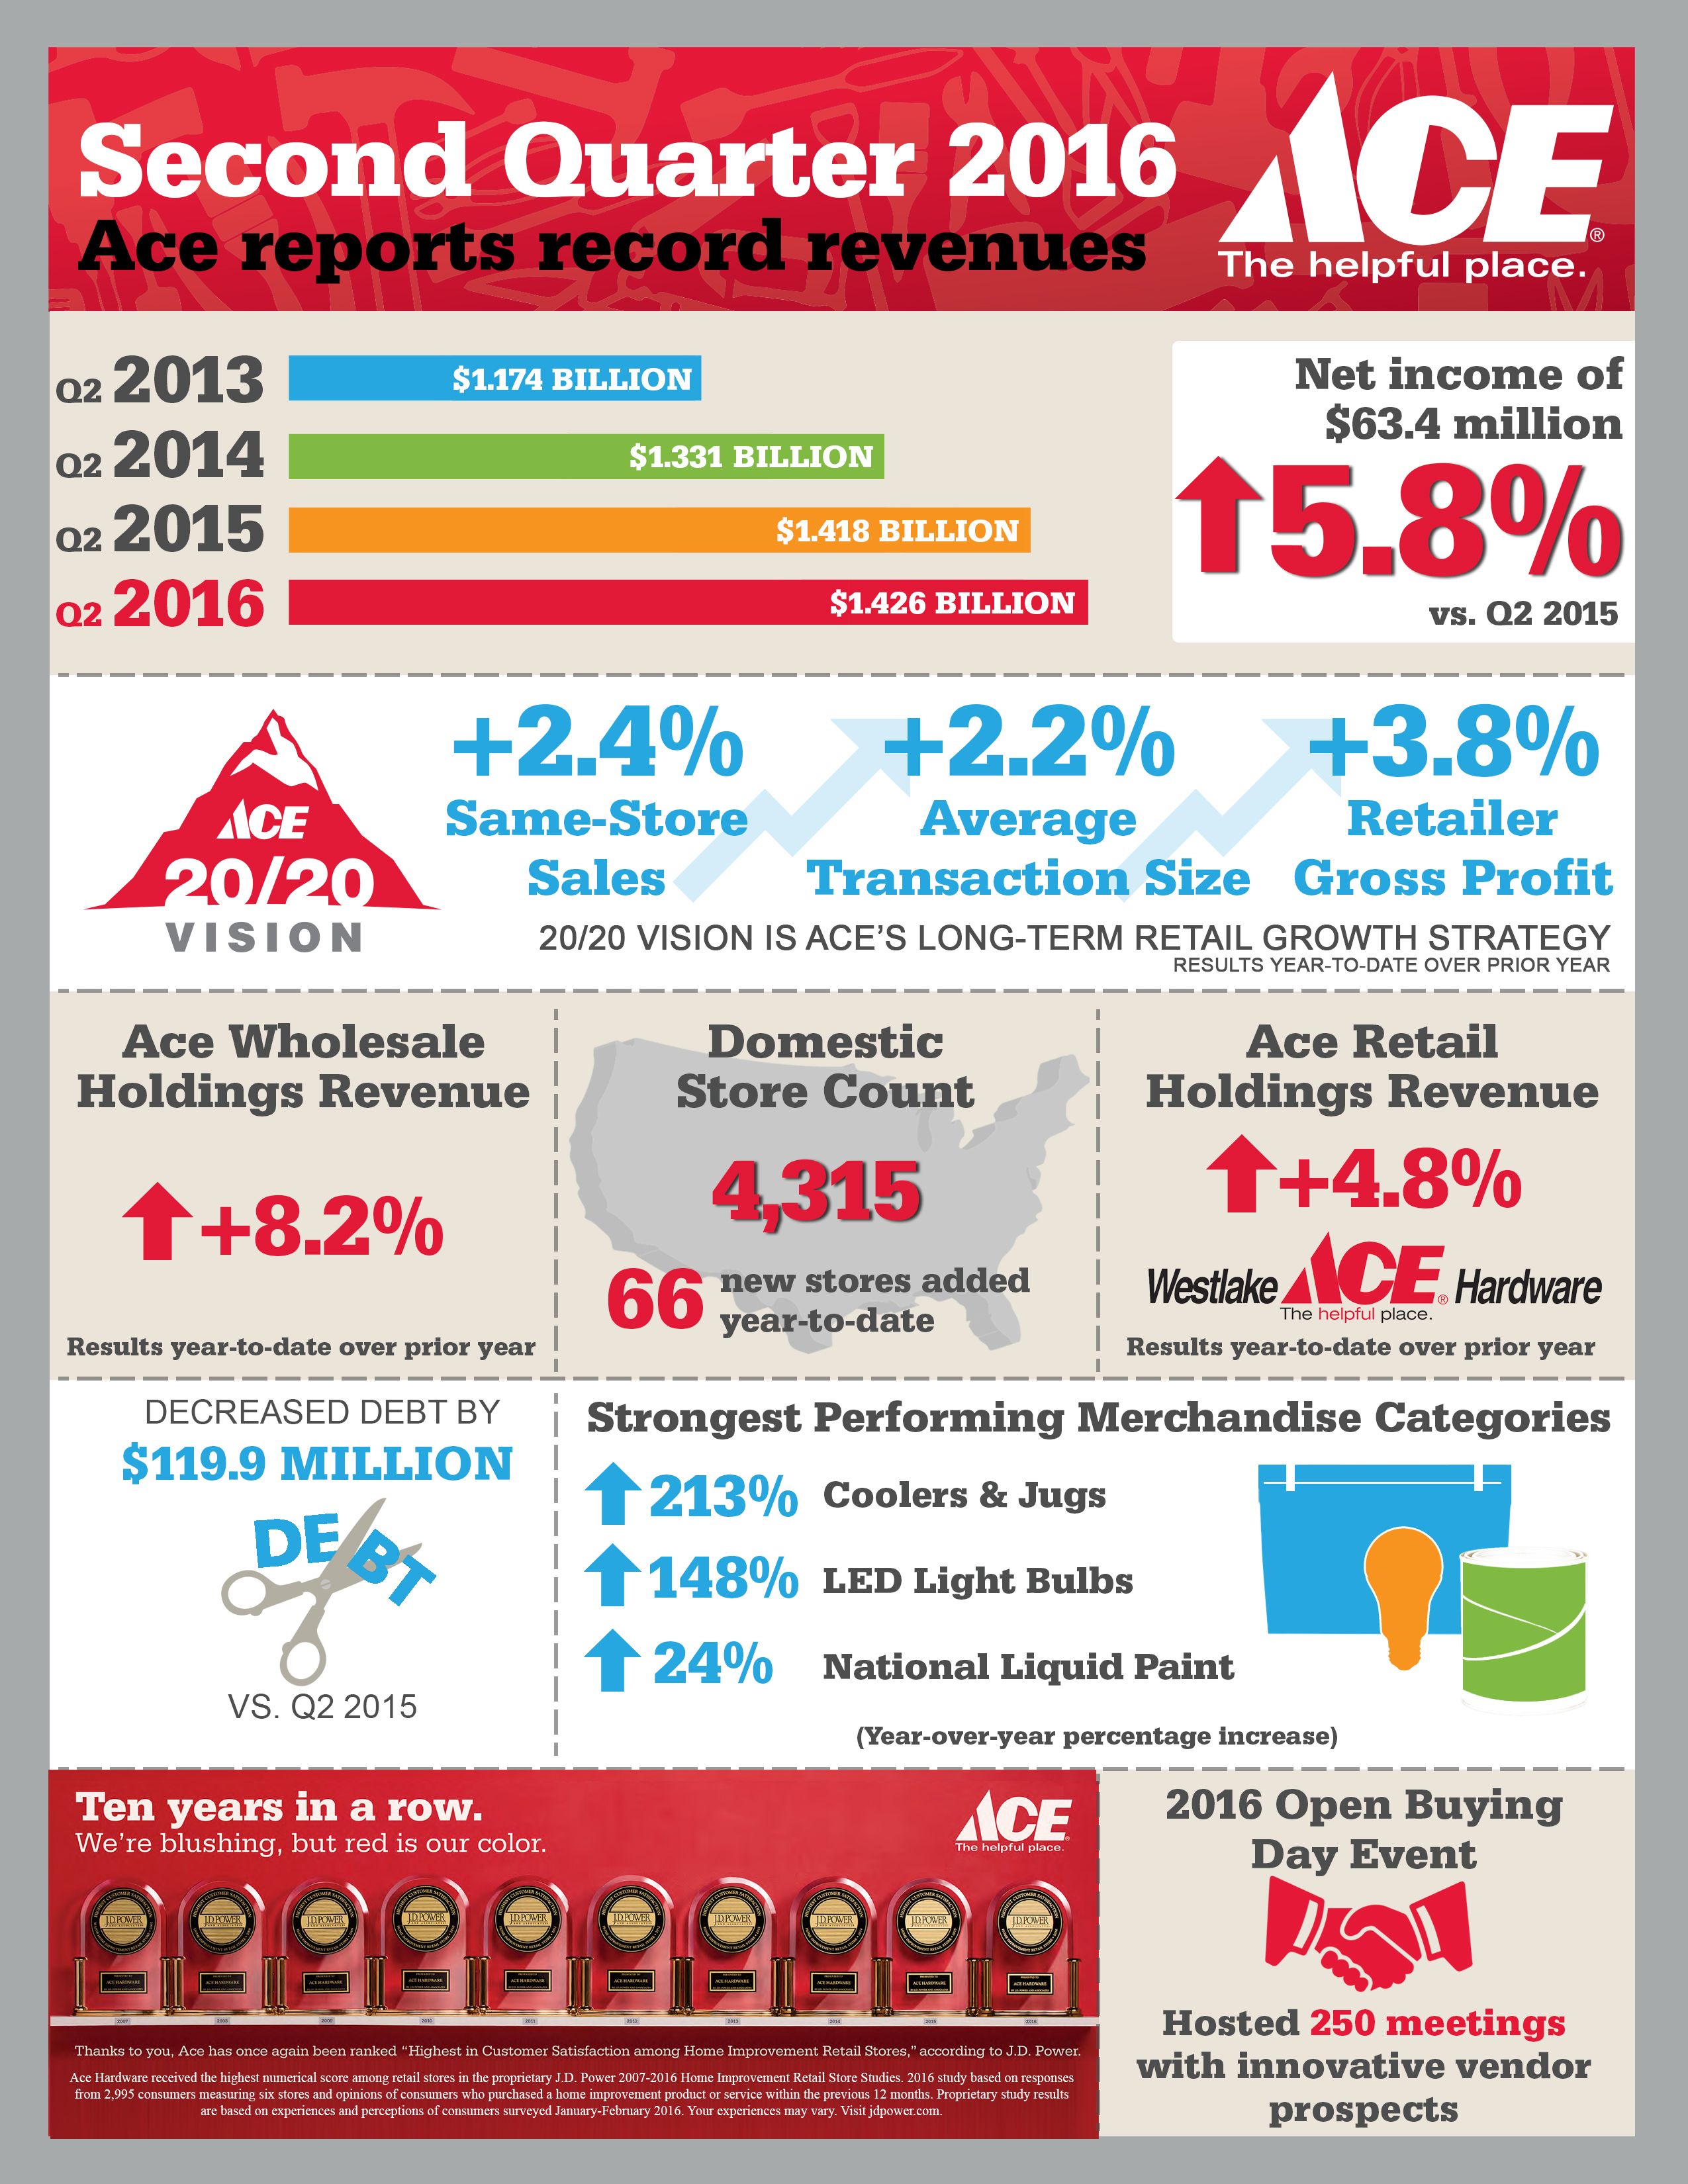
OAK BROOK, Ill.--(BUSINESS WIRE)--Ace Hardware Corporation (“Ace” or the “Company”), the largest retailer-owned hardware cooperative in the world, today reported second quarter 2016 revenues of $1.4 billion, an increase of $8.7 million or 0.6 percent from the second quarter of 2015. Net income was $63.4 million for the second quarter of 2016, an increase of $3.5 million from the second quarter of 2015 and the second highest in Company history.
“New store growth was the primary driver of our record revenue,” said John Venhuizen, President and CEO. “While records are nice, we are not satisfied with the growth as the enterprise and our retailers are working far too hard to settle for modest increases. Given their collective and effective execution year-to-date, I remain optimistic about accelerating both our growth and earnings going forward.”
For the first six months of 2016, the 2.4 percent increase in retail same-store-sales reported by the approximately 3,000 Ace retailers who share daily retail sales data was primarily the result of a 2.2 percent increase in average transaction size.
Revenues
Consolidated revenues for the quarter ended July 2, 2016 totaled $1.4 billion. Total wholesale revenues were $1.3 billion, an increase of $6.7 million, or 0.5 percent, as compared to the prior year second quarter. Increases were noted across many departments with outdoor living, paint and lawn and garden showing the largest gains.
Wholesale merchandise revenues to new domestic stores activated from January 2015 through June 2016 contributed $29.1 million in incremental revenues during the quarter, while wholesale merchandise revenues decreased $14.1 million due to stores that cancelled their membership. Wholesale merchandise revenues to comparable stores decreased $3.0 million in the second quarter of 2016. The Company’s Ace Wholesale Holdings LLC (“AWH”) subsidiary contributed $4.1 million of incremental revenue in the second quarter of 2016, which was an increase of 4.4 percent from the prior year second quarter.
Retail revenues from Ace Retail Holdings (“ARH”) were $87.4 million in the second quarter of 2016. This was an increase of $2.0 million, or 2.3 percent, from the second quarter of 2015. Same-store-sales increased 1.6 percent compared to the prior year with the largest increases in outdoor living and lawn and garden.
Ace added 42 new domestic stores in the second quarter of 2016 and cancelled 29 stores. This brought the Company’s total domestic store count to 4,315 at the end of the second quarter of 2016, an increase of 59 stores from the second quarter of 2015.
Gross Profit
Wholesale gross profit for the three months ended July 2, 2016 was $172.5 million, an increase of $9.0 million from the second quarter of 2015. The wholesale gross margin percentage was 12.9 percent of wholesale revenues in the second quarter of 2016, an increase from the 2015 second quarter gross margin percentage of 12.3 percent. The increase in the wholesale gross margin percentage was primarily driven by the timing of income from vendors.
Retail gross profit for the second quarter of 2016 was $38.3 million, an increase of $1.2 million from the second quarter of 2015. The retail gross margin percentage was 43.8 percent of retail revenues in the second quarter of 2016, up from 43.4 percent in the prior year second quarter. The increase in the retail gross margin percentage was primarily the result of less clearance merchandise sold in the second quarter of 2016. Retail gross profit is determined based on the Company’s wholesale acquisition cost of product, not ARH’s acquisition cost which includes a markup from the Company.
Expenses
Wholesale operating expenses increased $12.1 million, or 11.5 percent, for the second quarter of 2016 as compared to the second quarter of 2015. The increase was primarily due to a one-time gain of $10.0 million that reduced operating expenses in the second quarter of 2015. As a percentage of wholesale revenues, wholesale operating expenses increased from 7.9 percent of wholesale revenues in the second quarter of 2015 to 8.8 percent of wholesale revenues in the second quarter of 2016. Excluding the one-time gain in 2015, wholesale operating expenses increased slightly from 8.7 percent of wholesale revenues in 2015 to 8.8 percent in 2016.
Retail operating expenses of $25.9 million increased $0.2 million, or 0.8 percent, in the second quarter of 2016 as compared to the second quarter of 2015. The increase was primarily driven by higher expenses from new retail stores added in the third quarter of 2015 and the second quarter of 2016. Retail operating expenses as a percentage of retail revenues decreased to 29.6 percent of retail revenues in the second quarter of 2016 from 30.1 percent in second quarter of 2015.
Balance Sheet
Receivables decreased $29.0 million from the second quarter of 2015 as a result of lower past due balances on trade receivables.
Inventories decreased $32.4 million from the second quarter of 2015 primarily due to a decrease in LED lighting and seasonal merchandise.
Debt decreased $119.9 million versus the second quarter of 2015 as a result of cash provided by the Company’s operating activities during the past twelve months.
About Ace Hardware
For more than 90 years, Ace Hardware has been known as the place with the helpful hardware folks in thousands of neighborhoods across America, providing customers with a more personal kind of helpful. In 2016, Ace ranked “Highest in Customer Satisfaction with Home Improvement Retail Stores” for the tenth year in a row according to J.D. Power*. With more than 4,900 hardware stores locally owned and operated across the globe, Ace is the largest retailer-owned hardware cooperative in the world. Headquartered in Oak Brook, Ill., Ace and its subsidiaries currently operate 17 distribution centers in the U.S. and also have distribution capabilities in Shanghai, China; Panama City, Panama; and Dubai, United Arab Emirates. Its retailers' stores are located in all 50 states, the District of Columbia and approximately 60 countries. For more information on Ace, visit www.acehardware.com.
* Ace Hardware received the highest numerical score among retail stores in the proprietary J.D. Power 2016 Home Improvement Retail Store StudySM. Study based on responses from 2,995 consumers measuring six stores and opinions of consumers who purchased a home improvement product or service within the previous 12 months. Proprietary study results are based on experiences and perceptions of consumers surveyed January-February 2016. Your experiences may vary. Visit jdpower.com
| ACE HARDWARE CORPORATION | ||||||||||||||||
| CONSOLIDATED STATEMENTS OF INCOME | ||||||||||||||||
| (Unaudited, in millions) | ||||||||||||||||
| Three Months Ended | Six Months Ended | |||||||||||||||
| July 2, | July 4, | July 2, | July 4, | |||||||||||||
| 2016 | 2015 | 2016 | 2015 | |||||||||||||
| (13 Weeks) | (13 Weeks) | (26 Weeks) | (26 Weeks) | |||||||||||||
| Revenues: | ||||||||||||||||
| Wholesale revenues | $ | 1,338.8 | $ | 1,332.1 | $ | 2,525.0 | $ | 2,471.9 | ||||||||
| Retail revenues | 87.4 | 85.4 | 138.0 | 131.7 | ||||||||||||
| Total revenues | 1,426.2 | 1,417.5 | 2,663.0 | 2,603.6 | ||||||||||||
| Cost of revenues: | ||||||||||||||||
| Wholesale cost of revenues | 1,166.3 | 1,168.6 | 2,219.2 | 2,170.3 | ||||||||||||
| Retail cost of revenues | 49.1 | 48.3 | 75.7 | 72.3 | ||||||||||||
| Total cost of revenues | 1,215.4 | 1,216.9 | 2,294.9 | 2,242.6 | ||||||||||||
| Gross profit: | ||||||||||||||||
| Wholesale gross profit | 172.5 | 163.5 | 305.8 | 301.6 | ||||||||||||
| Retail gross profit | 38.3 | 37.1 | 62.3 | 59.4 | ||||||||||||
| Total gross profit | 210.8 | 200.6 | 368.1 | 361.0 | ||||||||||||
| Distribution operations expenses | 34.2 | 33.5 | 67.6 | 64.5 | ||||||||||||
| Selling, general and administrative expenses | 41.0 | 33.0 | 83.9 | 76.3 | ||||||||||||
| Retailer success and development expenses | 42.4 | 39.0 | 71.4 | 69.7 | ||||||||||||
| Retail operating expenses | 25.9 | 25.7 | 49.1 | 47.7 | ||||||||||||
| Warehouse facility closure costs | - | 0.2 | - | 1.7 | ||||||||||||
| Total operating expenses | 143.5 | 131.4 | 272.0 | 259.9 | ||||||||||||
| Operating income | 67.3 | 69.2 | 96.1 | 101.1 | ||||||||||||
| Interest expense | (3.2 | ) | (5.8 | ) | (6.6 | ) | (9.3 | ) | ||||||||
| Interest income | 0.9 | 0.9 | 1.7 | 1.7 | ||||||||||||
| Other income, net | 1.8 | 1.6 | 3.1 | 3.8 | ||||||||||||
| Income tax expense | (3.4 | ) | (6.0 | ) | (4.8 | ) | (7.5 | ) | ||||||||
| Net income | 63.4 | 59.9 | 89.5 | 89.8 | ||||||||||||
| Less: net income attributable to noncontrolling interests | 0.2 | 2.4 | 0.3 | 2.4 | ||||||||||||
| Net income attributable to Ace Hardware Corporation | $ | 63.2 | $ | 57.5 | $ | 89.2 | $ | 87.4 | ||||||||
| Patronage distributions accrued | $ | 54.9 | $ | 43.9 | $ | 84.2 | $ | 78.4 | ||||||||
| Patronage distributions accrued for third party retailers | $ | 53.9 | $ | 43.1 | $ | 82.2 | $ | 76.8 | ||||||||
| ACE HARDWARE CORPORATION | ||||||||||
| CONSOLIDATED BALANCE SHEETS | ||||||||||
| (In millions, except share data) | ||||||||||
| July 2, | January 2, | July 4, | ||||||||
| 2016 | 2016 | 2015 | ||||||||
| Assets | (Unaudited) | (Audited) | (Unaudited) | |||||||
| Cash and cash equivalents | $ | 19.1 | $ | 11.3 | $ | 35.3 | ||||
| Marketable securities | 47.5 | 47.1 | 42.8 | |||||||
| Receivables, net of allowance for doubtful accounts of $8.2, $8.3 and $7.9, respectively | 440.5 | 375.3 | 469.5 | |||||||
| Inventories | 774.7 | 714.5 | 807.1 | |||||||
| Prepaid expenses and other current assets | 46.2 | 45.1 | 53.4 | |||||||
| Total current assets | 1,328.0 | 1,193.3 | 1,408.1 | |||||||
| Property and equipment, net | 321.5 | 318.1 | 316.8 | |||||||
| Notes receivable, net of allowance for doubtful accounts of $8.0, $8.7 and $9.4, respectively | 13.7 | 11.8 | 15.8 | |||||||
| Goodwill and other intangible assets | 35.0 | 35.3 | 35.7 | |||||||
| Other assets | 98.1 | 98.7 | 87.2 | |||||||
| Total assets | $ | 1,796.3 | $ | 1,657.2 | $ | 1,863.6 | ||||
| Liabilities and Equity | ||||||||||
| Current maturities of long-term debt | $ | 19.7 | $ | 27.2 | $ | 19.4 | ||||
| Accounts payable | 786.5 | 552.5 | 799.0 | |||||||
| Patronage distributions payable in cash | 33.7 | 57.5 | 31.6 | |||||||
| Patronage refund certificates payable | 8.5 | 8.6 | 6.6 | |||||||
| Accrued expenses | 146.7 | 172.9 | 147.7 | |||||||
| Total current liabilities | 995.1 | 818.7 | 1,004.3 | |||||||
| Long-term debt | 162.2 | 242.2 | 282.4 | |||||||
| Patronage refund certificates payable | 55.4 | 41.3 | 42.2 | |||||||
| Other long-term liabilities | 65.6 | 58.9 | 56.8 | |||||||
| Total liabilities | 1,278.3 | 1,161.1 | 1,385.7 | |||||||
| Member Retailers’ Equity: | ||||||||||
| Class A voting common stock, $1,000 par value, 10,000 shares authorized, 2,714; 2,734 and 2,739 issued and outstanding, respectively | 2.7 | 2.7 | 2.7 | |||||||
| Class C nonvoting common stock, $100 par value, 6,000,000 shares authorized, 4,204,885; 3,756,627 and 3,847,785 issued and outstanding, respectively | 420.5 | 375.7 | 384.8 | |||||||
| Class C nonvoting common stock, $100 par value, issuable to retailers for patronage distributions, 293,685; 564,155 and 300,284 shares issuable, respectively | 29.4 | 56.4 | 30.0 | |||||||
| Contributed capital | 20.2 | 20.7 | 20.7 | |||||||
| Retained earnings | 35.4 | 28.4 | 26.0 | |||||||
| Accumulated other comprehensive (loss) income | (2.0 | ) | 0.2 | 1.2 | ||||||
| Equity attributable to Ace member retailers | 506.2 | 484.1 | 465.4 | |||||||
| Equity attributable to noncontrolling interests | 11.8 | 12.0 | 12.5 | |||||||
| Total equity | 518.0 | 496.1 | 477.9 | |||||||
| Total liabilities and equity | $ | 1,796.3 | $ | 1,657.2 | $ | 1,863.6 | ||||
| ACE HARDWARE CORPORATION | ||||||||
| CONSOLIDATED STATEMENTS OF CASH FLOWS | ||||||||
| (Unaudited, in millions) | ||||||||
| Six Months Ended | ||||||||
| July 2, | July 4, | |||||||
| 2016 | 2015 | |||||||
| (26 Weeks) | (26 Weeks) | |||||||
| Operating Activities | ||||||||
| Net income | $ | 89.5 | $ | 89.8 | ||||
| Adjustments to reconcile net income to net cash provided by operating activities: | ||||||||
| Depreciation and amortization | 25.3 | 25.4 | ||||||
| Amortization of deferred financing costs | 0.2 | 0.5 | ||||||
| Loss on early extinguishment of debt | - | 2.2 | ||||||
| Gain on the disposal of assets, net | (0.1 | ) | (0.1 | ) | ||||
| Provision for doubtful accounts | (0.3 | ) | 2.5 | |||||
| Other, net | 0.1 | - | ||||||
| Changes in operating assets and liabilities, exclusive of effect of acquisitions: | ||||||||
| Receivables | (83.0 | ) | (112.9 | ) | ||||
| Inventories | (59.7 | ) | (110.5 | ) | ||||
| Other current assets | (1.1 | ) | (1.7 | ) | ||||
| Other long-term assets | 1.0 | (0.8 | ) | |||||
| Accounts payable and accrued expenses | 210.5 | 182.3 | ||||||
| Other long-term liabilities | 2.6 | (10.6 | ) | |||||
| Deferred taxes | 0.3 | 0.3 | ||||||
| Net cash provided by operating activities | 185.3 | 66.4 | ||||||
| Investing Activities | ||||||||
| Purchases of marketable securities | (2.3 | ) | (4.4 | ) | ||||
| Proceeds from sale of marketable securities | 2.7 | 3.5 | ||||||
| Purchases of property and equipment | (30.5 | ) | (16.8 | ) | ||||
| Cash paid for acquired businesses, net of cash acquired | (0.6 | ) | (5.6 | ) | ||||
| Decrease in notes receivable, net | 1.1 | 0.8 | ||||||
| Other | - | 0.1 | ||||||
| Net cash used in investing activities | (29.6 | ) | (22.4 | ) | ||||
| Financing Activities | ||||||||
| Net (payments) borrowings under revolving lines of credit | (88.9 | ) | 186.7 | |||||
| Principal payments on long-term debt | (3.7 | ) | (173.2 | ) | ||||
| Payments of deferred financing costs | - | (1.1 | ) | |||||
| Payments of cash portion of patronage distribution | (53.7 | ) | (48.9 | ) | ||||
| Payments of patronage refund certificates | (0.2 | ) | (0.1 | ) | ||||
| Repurchase of stock | (0.7 | ) | (2.5 | ) | ||||
| Purchase of noncontrolling interest | (1.2 | ) | - | |||||
| Other | 0.5 | 0.6 | ||||||
| Net cash used in financing activities | (147.9 | ) | (38.5 | ) | ||||
| Increase in cash and cash equivalents | 7.8 | 5.5 | ||||||
| Cash and cash equivalents at beginning of period | 11.3 | 29.8 | ||||||
| Cash and cash equivalents at end of period | $ | 19.1 | $ | 35.3 | ||||
| Supplemental disclosure of cash flow information: | ||||||||
| Interest paid | $ | 6.2 | $ | 6.1 | ||||
| Income taxes paid | $ | 0.6 | $ | 0.7 | ||||