

Newsroom
Sorted by: Latest
-
Rio Tinto donates A$1.5 million to support Qld and NT communities impacted by Severe Tropical Cyclone Narelle and recent widespread flooding
MELBOURNE, Australia--(BUSINESS WIRE)--Rio Tinto will donate A$1.5 million to support disaster relief efforts for communities in Queensland and the Northern Territory impacted by Severe Tropical Cyclone Narelle and recent widespread flooding, while also supporting longer-term preparedness and resilience for future emergencies. Rio Tinto will provide A$1 million to assist in Queensland and help Australian Red Cross and the State Emergency Service provide response and preparedness efforts for ext...

-
CrowdStrike Accelerates SMB Cybersecurity Transformation Across JAPAC with Expanded Distributor-Led Services
AUSTIN, Texas & DA NANG, Vietnam--(BUSINESS WIRE)--JAPAC Partner Symposium -- CrowdStrike (NASDAQ: CRWD) today announced an expansion of its Managed Security Service Provider (MSSP) go-to-market strategy across Japan and Asia Pacific (JAPAC), increasing access to the CrowdStrike Falcon® platform for small and medium-sized businesses (SMBs) and accelerating AI-driven cybersecurity transformation. Through expanded strategic partnerships with Dicker Data and Otsuka Corporation, this distributor-le...
-
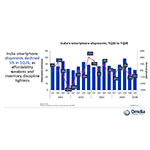
Omdia: India’s smartphone shipments fell 5% in 1Q26 amid channel caution and pricing pressures
LONDON--(BUSINESS WIRE)--The latest Omdia research shows that India’s smartphone shipments fell by 5% year on year to 30.9 million units in 1Q26, reflecting seasonally weak demand compounded by cautious channel inventory strategies. Demand was pressured by macro headwinds, including rupee depreciation and rising inflation weighing on affordability and delayed consumer upgrades. Additionally, earlier front-loading ahead of expected price increases limited incremental channel intake. vivo retaine...
-
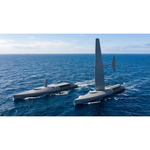
Samenvatting: Saildrone onthult Spectre, een nieuwe klasse hoge snelheids-USV (Unmanned Surface Vessel) voor maritieme operaties
NATIONAL HARBOR, Md.--(BUSINESS WIRE)--Saildrone, wereldleider en meest ervaren operator van USV's (Unmanned Surface Vehicles), publiceerde vandaag het ontwerp van de Saildrone Spectre, de culminatie van twee jaar intens ontwerpwerk dat meer dan 10 jaar operationele ervaring in USV's benut. Met een lengte van 52 meter (170 voet), een gewicht van 250 ton en een topsnelheid tot 30 knopen, is Spectre het grootste, snelste en meest competente Saildrone-platform tot op vandaag. Spectre is geoptimali...
-
Saildrone stellt Spectre vor, eine neue Klasse von unbemannten Hochgeschwindigkeits-Oberflächenfahrzeugen für Marineeinsätze
NATIONAL HARBOR, Maryland--(BUSINESS WIRE)--Saildrone, der Weltmarktführer und erfahrenste Betreiber unbemannter Oberflächenfahrzeuge (Unmanned Surface Vehicles, USVs), präsentierte heute das Design von Saildrone Spectre – das Ergebnis von zwei Jahren intensiver Entwicklungsarbeit, in die mehr als 10 Jahre Erfahrung im Betrieb von USVs eingeflossen sind. Mit einer Länge von 52 Metern (170 Fuß), einem Gewicht von 250 Tonnen und einer Geschwindigkeit von bis zu 30 Knoten ist Spectre die bislang g...

-
New Innovations in Ultimate Beneficial Owner (UBO) Discovery Drive 51% Growth in APAC Business Verification Volume for Trulioo
BANGKOK--(BUSINESS WIRE)--Trulioo Enables Leading Social Media Platform to Achieve Up to 40% Increase in UBO Coverage Across APAC with Next-Generation UBO Discovery...
-
2026 NAB Showが明日から開催、世界のメディアリーダーが一堂に会し、ストーリーテリングの未来を形作る
ワシントン--(BUSINESS WIRE)--(ビジネスワイヤ) -- 2026 NAB Showが4月18日(土)に開幕し、展示会場およびブースは4月19日にオープンします。この業界屈指のグローバルイベントでは、最も革新的な企業が注目を集め、メディア、エンターテインメント、テクノロジーの各分野から世界的に影響力のあるリーダーたちが一堂に会します。 NAB Showは、放送局、メディア企業、コンテンツクリエイター、そしてテクノロジー・イノベーターを大規模に結集させる唯一のプラットフォームとして、急速に進化するマルチプラットフォームの世界において、イノベーション、成長、そしてビジネスチャンスの創出を牽引する存在として、100年にわたる伝統を受け継いでいます。 NAB Showは、人工知能やクリエイターエコノミーから、スポーツ、ストリーミング、クラウド変革にいたるまで、ストーリーテリングの未来を推進するツール、人材、アイデアが集結する場となっています。 「NAB Showは、世界中のメディアエコシステムが一堂に会し、未来の可能性を探るだけでなく、それを構築する場としての役割を果たしてい...
-
Riassunto: Saildrone presenta Spectre, una nuova classe di imbarcazioni di superficie senza equipaggio ad alta velocità per operazioni navali
NATIONAL HARBOR, Md.--(BUSINESS WIRE)--Saildrone, il leader mondiale e l'operatore più esperto di veicoli di superficie senza equipaggio (USV), oggi ha rilasciato il progetto del Saildrone Spectre, il culmine di due anni di intenso lavoro di progettazione, basato su oltre 10 anni di esperienza operativa in ambito di USV. Con i suoi 52 metri (170 piedi) di lunghezza, 250 tonnellate di peso e velocità massima di 30 nodi, Spectre è la piattaforma Saildrone più grande, più veloce e più capace di se...

-
Ushio Industry & Entertainment nomina Takuya Matsumoto Presidente e CEO e indica la direzione strategica per la prossima fase
BERLINO--(BUSINESS WIRE)--Ushio Industry & Entertainment (Ushio INE GmbH) annuncia la nomina di Takuya Matsumoto a Presidente e Direttore generale, segnando una tappa storica nell'evoluzione dell'attività e la sua integrazione in Ushio Group. Con più di 20 anni di esperienza nel settore delle vendite, dello sviluppo di nuove attività e nelle operazioni globali, Takuya Matsumoto apporta profonde competenze e una solida esperienza in ruoli dirigenziali in Ushio. Più recentemente, Matsumoto ha...
-
Wolters Kluwer Future Ready CFO report shows APAC CFOs embrace AI with a governance‑first mindset, closely aligned with global peers
SINGAPORE--(BUSINESS WIRE)--CFOs across Asia‑Pacific are accelerating their engagement with artificial intelligence, according to the 2026 Future Ready CFO Survey – APAC Regional Insights. The findings show CFOs recognize AI’s growing influence on the finance function while advancing adoption in a deliberate, value‑driven manner. The survey shows that 83% of APAC CFOs cite the adoption and implementation of AI as a key force reshaping finance, closely aligned with the 85% global figure. This ne...