Newsroom
Sorted by: Latest
-
UK Debt Management Office UK Regulatory Announcement: Issue of Debt
LONDON--(BUSINESS WIRE)-- DMO-TAS041/3708/002 The Minster Building21 Mincing LaneLondonEC3R 7AG T 020 7862 6500F 020 7862 6509www.dmo.gov.uk A102\26 28 July 2026 PRESS NOTICE RESULT OF THE SALE BY TENDER OF UP TO £750 MILLION OF 4¼% TREASURY GILT 2040The United Kingdom Debt Management Office ("DMO") announces that the tender of up to £750 million of 4¼% Treasury Gilt 2040 (ISIN Code: GB00B6460505) has been allocated as follows:(Note: all prices in this notice are quoted in pounds a...
-
Open Lending and ANV Announce Results of Tender Offer
NEW YORK--(BUSINESS WIRE)--Open Lending Corporation (NASDAQ: LPRO) (“Open Lending”) and ANV Group Holdings Ltd. (“ANV”), a global insurance intermediary platform, today announced the results of ANV’s tender offer for any and all of the outstanding shares of Open Lending common stock (the “Shares”) at a price of $3.15 per Share. Equiniti Trust Company, LLC, the depositary and paying agent for the tender offer, has reported that, as of the expiration of the tender offer at one minute after 11:59...
-
CTP delivers major logistics hub for LPP Logistics at CTPark Bucharest West in under a year
AMSTERDAM--(BUSINESS WIRE)--Regulatory News: CTP, Europe’s largest listed owner, developer, and operator of logistics and industrial real estate by gross leasable area, has delivered a new 56,000 sqm distribution centre for LPP Logistics at CTPark Bucharest West, marking another milestone in the companies' long-term partnership and further expanding LPP Logistics' operations at the industrial park. The new facility has become operational and will strengthen LPP Group’s supply chain across South...
-
The Beachbody Company, Inc. Announces Second Quarter 2026 Earnings Release Date, Conference Call, and Webcast
EL SEGUNDO, Calif.--(BUSINESS WIRE)--The Beachbody Company, Inc. (NASDAQ: BODI) (“BODi” or the “Company”), the proactive wellness company delivering nutrition, supplements, and proven fitness programs that help people take control of their health inside and out, will release its second quarter 2026 results on Monday, August 10, 2026, after the U.S. stock market closes. The Company will host a conference call at 5:00 p.m. (Eastern Time) that day to discuss the results. The toll-free dial-in for...
-
Bending Spoons sottoscrive una linea di finanziamento a medio-lungo termine da 500 milioni di euro garantita da SACE
MILANO--(BUSINESS WIRE)--Bending Spoons S.p.A. (NASDAQ: BSP) ha annunciato oggi di aver sottoscritto un nuovo finanziamento a medio-lungo termine da 500 milioni di euro erogato da HSBC Continental Europe (in qualità di Sole Coordinator e MLA), Intesa Sanpaolo S.p.A. (in qualità di SACE Agent e MLA) e BPER Banca Corporate & Investment Banking (in qualità di Structuring Advisor e MLA). La linea di finanziamento, con scadenza a marzo 2031, beneficia di una garanzia fornita da SACE nel quadro d...
-
Bending Spoons enters into €500 million SACE-backed term loan facility
MILAN--(BUSINESS WIRE)--Bending Spoons S.p.A. (NASDAQ: BSP) announced today that it has entered into a new €500 million medium-long-term financing provided by HSBC Continental Europe (acting as Sole Coordinator and MLA), Intesa Sanpaolo S.p.A. (acting as SACE Agent and MLA), and BPER Banca Corporate & Investment Banking (acting as Structuring Advisor and MLA). The facility, which matures in March 2031, benefits from a guarantee provided by SACE, in advancement of SACE’s mission to support t...
-
PHINIA to Participate in Deutsche Bank Chicago Industrials Summit
AUBURN HILLS, Mich.--(BUSINESS WIRE)--PHINIA Inc. (NYSE: PHIN), a diversified, industrial supplier and global leader in the development of fuel systems, electrical systems and aftermarket solutions, announced today that it will participate in the Deutsche Bank Chicago Industrials Summit on Wednesday, August 12, 2026. Conference participation will be in-person and include a Q&A session to discuss dynamics across the various markets PHINIA serves around the world and the Company’s business. P...
-
World Cup Drives 60% Surge in Short-Term Rental Income in U.S. Host Cities
NEW YORK--(BUSINESS WIRE)--The 2026 FIFA World Cup delivered a significant boost to short-term rental (STR) owners in U.S. host markets, according to new customer data from Baselane, the leading banking and bookkeeping platform for real estate investors. Among the same Baselane STR hosts active in both June 2025 and June 2026, rental income across 11 U.S. host markets increased 60% year over year. By comparison, income among the same group of hosts in non-host markets grew 11%. Baselane custome...
-
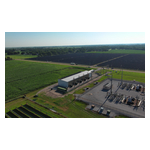
Fortitude Energizes 12 MW Grand Island, Nebraska Facility, Expanding Owned-and-Operated Power Portfolio
FAIRPORT, N.Y.--(BUSINESS WIRE)--Fortitude expands its owned power advantage by energizing its first greenfield build at an attractive power cost....
-
Cox Capital Expands Recurring Liquidity Program to Five Non-Traded BDCs Despite Universal NAV Decreases
PHILADELPHIA--(BUSINESS WIRE)--Cox Capital Partners ("Cox Capital") announced today that Cox Capital Retail Secondaries Fund I, LP (the "Purchaser") has added Blue Owl Credit Income Corp. ("OCIC") and Blue Owl Technology Income Corp. ("OTIC") to its Class I tender offer program. The Purchaser now has five cash tender offers open, including previously announced offers for HPS Corporate Lending Fund ("HLEND"), Apollo Debt Solutions BDC ("ADS") and Ares Strategic Income Fund ("ASIF"). Cox Capital...