

Newsroom
Sorted by: Latest
-
Crawford & Company® Announces Fourth Quarter and Full Year 2025 Earnings Conference Call
ATLANTA--(BUSINESS WIRE)--Crawford & Company® (NYSE: CRD-A and CRD-B) will issue its earnings release for its fourth quarter and full year ended December 31, 2025, on Monday, March 2, 2026, at 4:15 p.m. Eastern Time. The conference call, to discuss Crawford’s quarterly and full year earnings and other developments, will be held on Tuesday, March 3, 2026, at 8:30 a.m. Eastern Time. For audio access only, the call can be accessed by dialing 1-800-715-9871, Conference ID: 3834263. For audio an...
-
HSBC Bank PLC UK Regulatory Announcement: FRN Variable Rate Fix
LONDON--(BUSINESS WIRE)-- 19-February-2026 Issue: Coventry Building Society, CB Series 1 XS2245504480 Pursuant to our appointment as Agent for the above stated issue, please be advised of the following interest rate determination: Date From: 26-January-2026 Date To: 26-February-2026 Record Date: 25-February-2026 Value Date: 26-February-2026 Benchmark Rate: 3.7319% Margin: 0.53% Total Rate: 4.2619% Floor: 0% Number of Days: 31 Day Count: Actual / 365 (Fixed) Interest Frequency: Monthly Denomina...
-
HSBC Bank PLC UK Regulatory Announcement: FRN Variable Rate Fix
LONDON--(BUSINESS WIRE)-- 19-February-2026 Issue: Coventry Building Society, CB Series 3 XS2346562874 Pursuant to our appointment as Agent for the above stated issue, please be advised of the following interest rate determination: Date From: 26-January-2026 Date To: 26-February-2026 Record Date: 25-February-2026 Value Date: 26-February-2026 Benchmark Rate: 3.7319% Margin: 0.4% Total Rate: 4.1319% Floor: 0% Number of Days: 31 Day Count: Actual / 365 (Fixed) Interest Frequency: Monthly Denominat...
-
HSBC Bank PLC UK Regulatory Announcement: FRN Variable Rate Fix
LONDON--(BUSINESS WIRE)-- 19-February-2026 Issue: Coventry Building Society, CB Series 2 XS2245745927 Pursuant to our appointment as Agent for the above stated issue, please be advised of the following interest rate determination: Date From: 26-January-2026 Date To: 26-February-2026 Record Date: 25-February-2026 Value Date: 26-February-2026 Benchmark Rate: 3.7319% Margin: 0.53% Total Rate: 4.2619% Floor: 0% Number of Days: 31 Day Count: Actual / 365 (Fixed) Interest Frequency: Monthly Denomina...
-
ARDT Class Action Reminder: Stockholders Who Lost Money Investing in Ardent Health, Inc. Should Contact Robbins LLP for Information About Recovering Their Losses
SAN DIEGO--(BUSINESS WIRE)--Robbins LLP reminds stockholders that a class action was filed on behalf of all investors who purchased or otherwise acquired Ardent Health, Inc. (NYSE: ARDT) securities between July 18, 2025 and November 12, 2025. Ardent Health and its affiliates operate acute care hospitals and other healthcare facilities. For more information, submit a form, email attorney Aaron Dumas, Jr., or give us a call at (800) 350-6003. What are the allegations? Robbins LLP is Investigating...

-
First Trust Global Funds PLC UK Regulatory Announcement: Net Asset Value(s)
LONDON--(BUSINESS WIRE)-- Funds Date TIDM ISIN Code Shares in Issue Currency Net Asset Value NAV/per Share First Trust US Equity Income UCITS ETF 19.02.2026 UINC IE00BZBW4Z27 9,861,191.00 USD 377,871,253.33 38.319 ...
-
United Boys & Girls Clubs of Santa Barbara County Appoints Melinda Cabrera as New Chief Executive Officer
SANTA BARBARA, Calif.--(BUSINESS WIRE)--United Boys & Girls Clubs of Santa Barbara County (UBGC) announced today its Board of Directors has appointed Melinda Cabrera as Chief Executive Officer, effective March 16, 2026. The announcement follows an extensive search process conducted by the Board to identify a nonprofit leader with a proven track record of success. Previously, Ms. Cabrera served as President and CEO of the Scholarship Foundation of Santa Barbara, the nation’s largest communit...
-
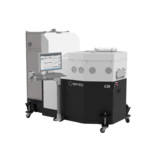
Kinko Optical Co., Ltd.选择Beneq C2R™技术,助力XR眼镜高性能AR波导的大规模生产
台湾台中--(BUSINESS WIRE)--(美国商业资讯)-- 亚洲领先的原始设计制造商(ODM)Kinko Optical Co., LTD.(简称Kinko)选择采用Beneq的C2R™等离子体增强空间原子层沉积(ALD)系统。此举将使Kinko能够为其合作伙伴大规模生产用于衍射波导的高折射率、低损耗间隙填充光学镀膜。 扩展现实(XR)行业正在迅速发展,其增长动力源于消费者对沉浸式增强现实(AR)体验的需求,例如XR眼镜等消费电子产品。近年来,全球领先的科技公司和原始设备制造商(OEM)纷纷在该领域投入巨资并进行创新。XR眼镜的核心是AR波导,其对于将数字图像无缝叠加到现实世界至关重要。为了获得最佳效果,先进的表面浮雕光栅(SRG+)和纳米压印光刻(NIL)是当前的主流技术平台,能够满足消费级应用在性能、生产和成本方面的要求。 然而,这些技术所创建的复杂3D纳米结构对传统的镀膜方法提出了重大挑战,传统方法往往无法达到所需的性能。因此,先进的光学镀膜对于提高效率、亮度和耐用性至关重要,同时还能实现可扩展的高性能制造。Beneq的C2R™技术满足了这些需求,能够提供卓越性能,并助力...
-
First Trust Global Funds PLC UK Regulatory Announcement: Net Asset Value(s)
LONDON--(BUSINESS WIRE)-- Funds Date TIDM ISIN Code Shares in Issue Currency Net Asset Value NAV/per Share First Trust US Equity Income UCITS ETF 19.02.2026 UNCU.LN IE00BD6GCF16 794,850.00 USD 36,267,291.05 45.628 ...
-
Citibank UK Regulatory Announcement: FRN Variable Rate Fix
LONDON--(BUSINESS WIRE)-- Re: Al Rajhi Sukuk Limited USD 80,000,000.00 MATURING: 28-May-2027 ISIN: XS3084333155 PLEASE BE ADVISED THAT THE INTEREST RATE FOR THE PERIOD 28-Nov-2025 TO 27-Feb-2026 HAS BEEN FIXED AT 4.63 PCT DAY BASIS: ACTUAL/360 INTEREST PAYABLE VALUE 27-Feb-2026 WILL AMOUNT TO: USD 11.69 PER USD 1,000.00 DENOMINATION ...