Newsroom
Sorted by: Latest
-
SmartStop Self Storage REIT Announces Appointment of New Management Board Member
LADERA RANCH, Calif.--(BUSINESS WIRE)--SmartStop Self Storage REIT Announces Appointment of New Management Board Member...
-
Si2 Compact Model Coalition Announces 2026 International Compact Modeling Conference
LONG BEACH, Calif.--(BUSINESS WIRE)--Si2, IEEE, and IEEE EDS are sponsoring the second edition of the International Compact Modeling Conference (ICMC). Paper deadline extended to March 2...
-
Institutional Property Advisors Brokers Sale and Arranges Financing for Boutique West Los Angeles Multifamily Asset
LOS ANGELES--(BUSINESS WIRE)--Institutional Property Advisors (IPA), a division of Marcus & Millichap (NYSE:MMI) dedicated to serving the company’s institutional clients, announced today the sale and financing of Luxe Villas, a 60-unit multifamily asset in the Brentwood neighborhood of Los Angeles, California. The property sold for $49,494,000, or $824,900 per unit. “Luxe Villas is one of the premier multifamily assets in Brentwood,” said Kevin Green, IPA executive managing director. “This...
-
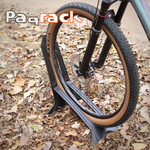
N-K Manufacturing Technologies Collaborates to Bring a Sustainable Bike Product to Market
GRAND RAPIDS, Mich.--(BUSINESS WIRE)--Shane Wiersma and Armen Kassouni became friends through their mutual love of mountain biking. Shane owns oddlyeven (www.oddlyeven.com), a design company specializing in 3D modeling, rendering, and animation. Armen owns N-K Manufacturing Technologies (www.nkmfgtech.com), an injection molding company specializing in horizontal, vertical, and two-shot molding. During one of their rides, Shane showed Armen his idea for an innovative bike stand he had created. A...
-
Skillsoft Announces New Employee Inducement Grant Under NYSE Rule 303A.08
BOSTON--(BUSINESS WIRE)--Skillsoft (NYSE: SKIL) (“Skillsoft” or the “Company”), the leading AI-native skills management platform built for the human + AI era, today announced that on February 18, 2026, the Talent and Compensation Committee of Skillsoft’s Board of Directors made a grant of 25,000 restricted stock units (“RSUs”) of the Company’s Class A common stock to David Koehn. The grant of RSUs was offered as a material inducement to Mr. Koehn’s hiring as SVP, Product Management on January 5...
-
Skillsoft Announces New Employee Inducement Grant Under NYSE Rule 303A.08
BOSTON--(BUSINESS WIRE)--Skillsoft (NYSE: SKIL) (“Skillsoft” or the “Company”), the leading AI-native skills management platform built for the human + AI era, today announced that on February 18, 2026, the Talent and Compensation Committee of Skillsoft’s Board of Directors (the “Committee”) made a grant of 95,000 restricted stock units (“RSUs”) of the Company’s Class A common stock to Bernard Barbour. The grant of RSUs was offered as a material inducement to Mr. Barbour’s hiring as Chief Techno...
-
Nauta Launches Tariff Recovery Module to Help Shippers Calculate Exposure and Accelerate Refund Claims
NEW YORK--(BUSINESS WIRE)--Nauta, the AI-native operating system for global supply chains, today announced the Nauta Tariff Recovery Module, designed to help shippers automatically calculate tariff exposure and generate a complete, broker-ready data package within minutes. The decision by the U.S. Supreme Court to strike down tariffs implemented under the IEEPA is expected to trigger a complex and time-sensitive refund process for shippers. The Nauta Tariff Recovery Module gives shippers the ab...
-
Cobalt AI Launches Advanced Data Infrastructure for AI Labs
SAN FRANCISCO--(BUSINESS WIRE)--Cobalt AI provides AI labs and investors with expert-curated datasets from Mayo Clinic physicians, SpaceX executives, and more....
-
Andersen Consulting styrker rådgivning inden for bygningsaktiver gennem samarbejde med Grinity
SAN FRANCISCO--(BUSINESS WIRE)--Andersen Consulting har indgået en samarbejdsaftale med Grinity, et rådgivningsfirma med speciale i bygningsaktiver, der leverer tekniske, miljømæssige og bæredygtige udviklingstjenester til bygge- og ejendomsmarkederne. Med sæde i Tjekkiet og Slovakiet og mere end 130 specialister betjener Grinity private og offentlige kunder inden for kommerciel udvikling, industri, teknologi, bilindustri og bæredygtighed. Virksomheden tilbyder tværfaglig ekspertise inden for p...
-
Community West Bancshares Announces Retirement of Board Member Tom L. Dobyns
FRESNO, Calif.--(BUSINESS WIRE)--The Board of Directors (“Board”) of Community West Bancshares (“Company”) (NASDAQ: CWBC), the parent company of Community West Bank (“Bank”), announced today that Tom L. Dobyns has elected to retire from the Boards of Directors of the Company and the Bank, effective March 31, 2026. Mr. Dobyns joined the Community West Bancshares and Community West Bank Boards of Directors on April 1, 2024, following the completion of the Company’s transformative merger. He previ...