

Newsroom
Sorted by: Latest
-
Ardabelle Reveals a €7 Trillion Challenge for Europe: Invest Now or Lose a Generation of Competitiveness
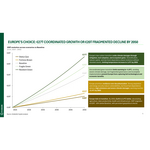
PARIS--(BUSINESS WIRE)--Europe is navigating a period of intense turbulence, where geopolitical crises, pressure on critical raw materials, and climate‑related shocks are reinforcing one another. This polycrisis is no longer cyclical: it is structurally reshaping the continent’s value chains and testing its industrial competitiveness. In this context, Ardabelle is releasing Greening the Arteries of Industry, a groundbreaking study that quantifies for the first time the economic gap between a Eu...
-
BlueDolphin Launches as the First AI-Powered Business Transformation Platform, Marking Strategic Rebrand from ValueBlue
NEW YORK & UTRECHT, Netherlands--(BUSINESS WIRE)--ValueBlue rebrands as BlueDolphin, launching an AI-powered business transformation platform that unifies strategy, architecture, and solution design....
-
Aelis Farma obtient une subvention de 458 k€ dans le cadre de France 2030 en Nouvelle-Aquitaine pour soutenir le développement de son programme dans l’obésité et les maladies métaboliques associées
BORDEAUX, France--(BUSINESS WIRE)--Regulatory News: Aelis Farma (ISIN : FR0014007ZB4 – Mnémonique : AELIS, éligible PEA-PME), société biopharmaceutique au stade clinique spécialisée dans le développement de traitements des maladies cérébrales et périphériques impliquant le récepteur CB1, annonce aujourd’hui avoir été sélectionnée dans le cadre du volet régionalisé de France 2030 en Nouvelle-Aquitaine et bénéficier à ce titre d’une subvention de 458 000 euros. Ce financement non dilutif contribu...
-
Aelis Farma Awarded a €458k Grant Under France 2030 in Nouvelle-Aquitaine to Support Development of Its Program in Obesity and Associated Metabolic Diseases
BORDEAUX, France--(BUSINESS WIRE)--Regulatory News: Aelis Farma (ISIN: FR0014007ZB4 – Ticker: AELIS), a clinical-stage biopharmaceutical company specializing in the development of treatments for brain and peripheral disorders involving the CB1 receptor, today announced that it has been selected under the regional component of France 2030 in Nouvelle-Aquitaine and has been awarded a grant of €458,000. This non-dilutive funding will help accelerate the Company’s research and development activitie...
-
Latecoere Reports 2025 Full Year Results
TOULOUSE, France--(BUSINESS WIRE)--Regulatory News: Latecoere (Paris:LAT), a Tier 1 supplier to major international aircraft manufacturers, announced that the Board of Directors approved Latecoere’s financial statements for the year ended December 31, 2025. André-Hubert Roussel, Group Chief Executive Officer, stated: “Our 2025 results mark a decisive step forward for Latecoere. With strong revenue growth, significant improvement in recurring EBITDA, and a return to positive operating cash flow,...
-
LATECOERE RESULTATS ANNUELS 2025
TOULOUSE, France--(BUSINESS WIRE)--Regulatory News: Latecoere (Paris:LAT), partenaire de rang 1 des avionneurs, annonce que son Conseil d’administration a approuvé les états financiers au 31 décembre 2025. André-Hubert Roussel, Directeur général du Groupe, a déclaré : « Nos résultats pour 2025 marquent une avancée décisive pour Latecoere. Avec une forte croissance du chiffre d’affaires, une amélioration significative de l’EBITDA courant et un retour à un flux de trésorerie d’exploitation positi...
-
AHF à l’occasion de la Journée mondiale de la santé : pas d’équité, pas d’accord sur les pandémies
LOS ANGELES--(BUSINESS WIRE)--À l’occasion de la Journée mondiale de la santé, célébrée chaque année le 7 avril, AIDS Healthcare Foundation (AHF) appelle à la solidarité mondiale pour lutter contre les maladies infectieuses et exhorte les principaux dirigeants mondiaux, en particulier en Europe, à y contribuer en faisant avancer un accord équitable de l’Organisation mondiale de la santé sur les pandémies, comprenant une annexe contraignante et applicable sur l’accès aux agents pathogènes et le...
-
Resumen: Tigo Energy lanza en el mercado residencial europeo su nuevo sistema de almacenamiento energético GO optimizado
MONTEVARCHI, Italia--(BUSINESS WIRE)--Tigo Energy, Inc. (NASDAQ: TYGO) («Tigo» o la «Empresa»), proveedor destacado de soluciones inteligentes de software y energía solar, ha anunciado hoy la disponibilidad de la batería Tigo GO, un sistema de almacenamiento energético de nueva generación y la última incorporación a su gama GO optimizada en Europa, donde se suma al cargador GO EV y a GO Junction para la integración con bombas de calor. El sistema permite ampliar la capacidad de almacenamiento h...
-
Tigo Energy führt neues GO-optimiertes Energiespeichersystem für den europäischen Wohnungsmarkt ein
MONTEVARCHI, Italien--(BUSINESS WIRE)--Tigo Energy, Inc. (NASDAQ: TYGO) („Tigo“ oder das „Unternehmen“), ein führender Anbieter von intelligenten Solar- und Energie-Softwarelösungen, gab heute die Verfügbarkeit der Tigo GO Battery bekannt, ein Energiespeichersystem der nächsten Generation und das neueste Produkt der optimierten Tigo GO-Produktreihe in Europa, das den GO EV Charger und GO Junction für die Integration von Wärmepumpen ergänzt. Das System bietet eine erweiterbare Energiespeicherkap...
-
Tigo Energy lance un nouveau système de stockage d'énergie optimisé GO sur le marché résidentiel européen
MONTEVARCHI, Italie--(BUSINESS WIRE)--Tigo Energy, Inc.(NASDAQ : TYGO) (« Tigo » ou la « Société »), fournisseur leader de solutions logicielles intelligentes pour l’énergie solaire, annonce aujourd’hui la disponibilité de la batterie Tigo GO , un système de stockage d’énergie de nouvelle génération. Ce système vient compléter la gamme de produits optimisés Tigo GO en Europe, aux côtés du chargeur GO pour véhicules électriques et du boîtier GO Junction pour l’intégration de pompes à chaleur. Il...