Newsroom
Sorted by: Latest
-
ERAS Investors Have Opportunity to Lead Erasca, Inc. Securities Fraud Lawsuit with the Schall Law Firm
LOS ANGELES--(BUSINESS WIRE)--ERAS Investors Have Opportunity to Lead Erasca, Inc. Securities Fraud Lawsuit with the Schall Law Firm...
-
Rosen Law Firm Encourages GoDaddy Inc. Investors to Inquire About Securities Class Action Investigation – GDDY
NEW YORK--(BUSINESS WIRE)--Why: Rosen Law Firm, a global investor rights law firm, announces an investigation of potential securities claims on behalf of shareholders of GoDaddy Inc. (NYSE: GDDY) resulting from allegations that GoDaddy may have issued materially misleading business information to the investing public. So What: If you purchased GoDaddy securities you may be entitled to compensation without payment of any out of pocket fees or costs through a contingency fee arrangement. The Rose...
-
Next Health Announces Inaugural Longevity Summit in Nashville Featuring Leading Health Experts
NASHVILLE, Tenn.--(BUSINESS WIRE)--Next Health announces the South’s first Longevity Summit, bringing leading health and performance experts to Nashville on September 12....

-
VIA Investors Have Opportunity to Lead Via Transportation, Inc. Securities Fraud Lawsuit with the Schall Law Firm
LOS ANGELES--(BUSINESS WIRE)--VIA Investors Have Opportunity to Lead Via Transportation, Inc. Securities Fraud Lawsuit with the Schall Law Firm...
-
COOCON加入全球AI代理基金會(AAIF),推動AI代理支付和基於MCP的資料業務
韓國首爾--(BUSINESS WIRE)--(美國商業資訊)-- 韓國領先的商業資料平台公司COOCON(執行長:Kim Jong-hyun,KOSDAQ 294570)宣布,已於6月1日加入AI代理基金會(AAIF),成為銀牌會員。 AAIF是一個開源的代理式AI基金會,是Linux基金會旗下的全球聯盟,匯集了包括Anthropic、OpenAI、Google、Microsoft、Circle、Tron和Stripe在內的180多家成員公司。該基金會致力於開發和管理旨在增強AI代理互通性的開放標準和協議,在推動AI產業的全球標準化方面發揮了關鍵作用。 透過加入AAIF,COOCON計劃拓展其全球網路,並與首屈一指的AI代理公司進行更深入的合作。該公司亦計劃參加與AI代理支付和基於模型上下文協議(MCP)的AI資料業務相關的工作小組,來加強其技術基礎。透過這些舉措,COOCON力求在支付和資料技術領域獲得次世代能力,同時增強其在全球市場的競爭力。 隨著AI代理迅速發展,其功能已不僅限於產品搜尋與購買建議,更進一步延伸至實際支付環節;因此,支付服務供應商被寄予厚望,以期能成為核心基礎設...
-
ASI Releases CEO Playbook for Scaling Autonomy Across Industrial Operations
MENDON, Utah--(BUSINESS WIRE)--Read “A CEO’s Playbook for Scaling Autonomous Off-Road Vehicles Across Your Operations” grounded in 25+ years of real-world autonomy deployments....
-
Venture Global anuncia el cierre de una emisión de bonos sénior garantizados por valor de $2250 millones
ARLINGTON, Va.--(BUSINESS WIRE)--Venture Global LNG, Inc. (“Venture Global”) anunció hoy que su subsidiaria de propiedad absoluta Venture Global LNG, Inc. (el “Emisor”) ha cerrado su oferta de $1125 millones en bonos sénior garantizados al 6,375 % con vencimiento en 2034 (los “Bonos de 2034”) y $1125 millones en bonos sénior garantizados al 6,625 % con vencimiento en 2036 (los “Bonos de 2036” y, junto con los Bonos de 2034, los “Bonos”). El Emisor utilizó los ingresos brutos de la oferta para a...
-
Beekeeper’s Naturals Issues Voluntary Nationwide Recall of Beekeeper’s Naturals Saline Nasal Spray Sold Through Amazon Due to Microbial Contamination
COVINA, Calif.--(BUSINESS WIRE)--Beekeeper’s Naturals is voluntarily recalling lot # 5950, Exp. Date 02/2028 of Beekeeper’s Naturals Saline Nasal Spray, sold only through Amazon, to the consumer level. This lot, produced at a third-party manufacturer, tested above our acceptable microbiological limits for yeast and may contain Aspergillus spp. In the population most at risk, such as people with weakened immune systems or lung diseases, there is a reasonable probability that use of the product w...

-
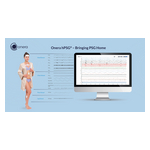
Onera présentera sa solution Onera hPSG® lors du congrès SLEEP 2026, qui se tiendra du 14 au 17 juin 2026 à Baltimore, dans le Maryland (États-Unis)
EINDHOVEN, Pays-Bas--(BUSINESS WIRE)--Onera Health, un chef de file dans la transformation de la médecine du sommeil, vient d’annoncer que sa solution complète de polysomnographie à domicile, Onera hPSG®, serait mise à l’honneur lors de plusieurs présentations scientifiques à l’occasion du prochain congrès SLEEP 2026. La société de technologie médicale présentera sa solution innovante sur stand n° 600 du plus grand congrès annuel sur la médecine du sommeil, qui réunit les principaux experts et...
-
Samenvatting: IQM-kwantumcomputer in gebruik genomen bij supercomputercentrum CINECA in Italië, een boost voor nationale computerinfrastructuur en onderzoek
BOLOGNA, Italië--(BUSINESS WIRE)--Het Italiaanse onderzoekscentrum voor high-performance computing, big data en kwantumcomputing (ICSC) heeft vandaag de IQM Radiance 54-kwantumcomputer in gebruik genomen bij CINECA, een van de toonaangevende supercomputercentra van Europa. Deze computer maakt geavanceerde toepassingen mogelijk op het gebied van optimalisatie, simulatie en machine learning. Deze bekendmaking is officieel geldend in de originele brontaal. Vertalingen zijn slechts als leeshulp bed...