

Newsroom
Sorted by: Latest
-
Samenvatting: De Britse AI-minister Kanishka Narayan neemt deel aan de AI Summit London, terwijl het programma voor het 10-jarig jubileum zich uitbreidt naar bedrijfs-AI, innovatie en beleid
LONDEN--(BUSINESS WIRE)--The AI Summit London heeft vandaag de volledige agenda bekendgemaakt voor de langverwachte editie ter gelegenheid van het 10-jarig jubileum, met het meest uitgebreide en toekomstgerichte programma tot nu toe. De Summit wordt gehouden op 10 en 11 juni in Tobacco Dock en is het belangrijkste AI-evenement van London Tech Week 2026. Er worden meer dan 5.000 bezoekers, 300 sprekers, meer dan 100 sponsors en exposanten verwacht. Kanishka Narayan, minister van AI en online vei...
-
Riassunto: Kanishka Narayan, il ministro britannico per l'intelligenza artificiale, partecipa a The AI Summit London mentre l'agenda del 10° anniversario si estende negli ambiti enterprise AI, innovazione e politiche
LONDRA--(BUSINESS WIRE)--The AI Summit London oggi ha pubblicato il programma completo della sua attesissima edizione speciale per il 10° anniversario, la vetrina più ampia e orientata al futuro di sempre. Il Summit, che si svolgerà il 10 e 11 giugno al Tobacco Dock, rappresenta la punta di diamante della London Tech Week 2026 e prevede la partecipazione di oltre 5.000 visitatori, 300 relatori e più di 100 sponsor ed espositori, oltre a una presentazione speciale per dirigenti da parte di Kanis...
-
Kanishka Narayan, ministre britannique chargé de l’IA, se joindra à l’AI Summit London tandis que le programme de ce 10e anniversaire s’étend à l’IA d’entreprise, à l’innovation et aux politiques publiques
LONDRES--(BUSINESS WIRE)--L’AI Summit London a dévoilé aujourd’hui le programme complet de son édition très attendue marquant son 10e anniversaire, proposant ainsi le programme le plus ambitieux et le plus tourné vers l’avenir à ce jour. Se déroulant les 10 et 11 juin au Tobacco Dock en tant qu’événement phare de la London Tech Week 2026, le sommet attend plus de 5 000 participants, 300 intervenants, plus de 100 sponsors et exposants, ainsi qu’une présentation spéciale de Kanishka Narayan, mini...
-
Resumen: El ministro de IA del Reino Unido, Kanishka Narayan, participará en The AI Summit London, y el programa del décimo aniversario se amplía para incluir la IA empresarial, la innovación y las políticas
LONDRES--(BUSINESS WIRE)--The AI Summit London ha presentado hoy la agenda completa de su esperada edición del décimo aniversario, con el programa más amplio y orientado al futuro hasta la fecha. La cumbre, que se celebrará los días 10 y 11 de junio en Tobacco Dock como evento principal de IA de la London Tech Week 2026, espera contar con más de 5.000 asistentes, 300 ponentes, más de 100 patrocinadores y expositores, así como una presentación especial para ejecutivos a cargo de Kanishka Narayan...
-
Der britische KI-Minister Kanishka Narayan nimmt am AI Summit London teil, dessen Programm zum 10-jährigen Jubiläum die Bereiche Unternehmens-KI, Innovation und Politik abdeckt
LONDON--(BUSINESS WIRE)--Der AI Summit London hat heute das vollständige Programm für seine mit Spannung erwartete Jubiläumsausgabe zum 10-jährigen Bestehen vorgestellt und präsentiert damit sein bislang umfangreichstes und zukunftsorientiertestes Programm. Der Summit findet vom 10. bis 11. Juni im Tobacco Dock als Haupt-KI-Veranstaltung der London Tech Week 2026 statt. Erwartet werden mehr als 5.000 Teilnehmer, 300 Referenten, über 100 Sponsoren und Aussteller, außerdem gibt es einen besondere...
-
Mevion Announces First Clinical Treatment on the MEVION S250-FIT™ Proton Therapy System
LITTLETON, Mass.--(BUSINESS WIRE)--Mevion Medical Systems, a global leader in compact proton therapy, today announced that the world’s first clinical proton therapy treatment delivered inside an existing conventional radiation therapy vault has been completed at Stanford Medicine Cancer Center. The treatment was delivered on the MEVION S250-FIT Proton Therapy System™. The milestone establishes a new category of proton therapy delivery: a compact single-room system that fits within existing radi...
-
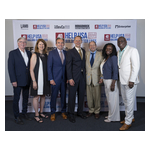
HELP USA Honors Five Leaders Driving Progress in Housing and Homelessness Prevention at HELP Heroes Night 2026
NEW YORK--(BUSINESS WIRE)--On Wednesday, June 3, HELP USA brought together leaders from across the housing, healthcare, philanthropy, business, government, and nonprofit sectors for HELP Heroes Night 2026, recognizing five individuals whose work has helped expand housing access, prevent homelessness, and strengthen communities. Held at Tribeca 360 in Lower Manhattan, the event brought together nearly 300 guests in support of HELP USA's work serving more than 35,000 individuals and families each...
-
The Open Group 发布 Industrial Advanced Nuclear™ Consortium 首份应用场景白皮书
美国旧金山--(BUSINESS WIRE)--(美国商业资讯)-- 作为一家厂商中立的技术标准组织,The Open Group 今日宣布发布《Industrial Advanced Nuclear™ Consortium(IANC)应用场景白皮书》。该白皮书系统阐述了先进核能技术在重工业领域的部署路径,展示其如何为行业提供可靠的低碳热能与电力供应。 这份由 Industrial Advanced Nuclear™ Consortium(IANC)牵头编制的白皮书,标志着核能在能源转型进程中的角色迈出了重要一步。作为一个由工业终端用户主导的组织,IANC 在白皮书中阐述了小型模块化反应堆(SMR)和微型模块化反应堆(MMR)直接融入工业生产运营的实际应用场景,重点聚焦于多个最难实现脱碳的行业领域,包括: 海上能源行业 炼油与石化行业 采矿业 高耗能制造业 该白皮书由行业领先的工业终端用户共同编制,全面梳理了相关行业面临的运营需求、能源需求及现实约束,为这些领域提供了统一而清晰的行业视角。白皮书强调,先进核能的价值不仅限于传统发电,更可作为一种可靠、持续且全天候运行的过程热和电力来源,...
-
STARTEEPO Invest、2026年第2四半期決算発表を前にゼロックス株の保有比率を6%超に引き上げ
プラハ--(BUSINESS WIRE)--(ビジネスワイヤ) -- 上場株式への投資に特化したオルタナティブ投資ファンドであるSTARTEEPO Invest(STARTEEPO)は、米国証券取引委員会(SEC)への修正届出書(Schedule 13D)において、ゼロックス・ホールディングス・コーポレーション(ゼロックス)の実質所有権を、発行済み普通株式の6%超に引き上げたことを発表しました。 今回の株式取得により、STARTEEPOはゼロックスの普通株式約800万株を実質的に保有し、さらに14万株のオプションを保有していることになります。公開されている所有権情報に基づくと、STARTEEPOは現在、ゼロックスの第3位の大株主となっています。 STARTEEPO Investの取締役会長であるフランティシェク・ボストルは、「当社は引き続き、ゼロックスを確信度の高い投資対象とし、ポートフォリオにおける最大規模のポジションの1つと位置付けています。当社は、ゼロックスの公開情報、戦略的イニシアチブ、および変革への取り組みを継続的に分析する中で、確信を深めています」と述べています。 202...
-
UFP Technologies to Present and Host 1x1 Investor Meetings at the 16th Annual East Coast IDEAS Investor Conference on June 10th in New York, NY
NEWBURYPORT, Mass.--(BUSINESS WIRE)--UFP Technologies, Inc. (Nasdaq: UFPT), today announced that Mitchell Rock, Chief Executive Officer, and Ron Lataille, Sr. Vice President, Treasurer and Chief Financial Officer, will present at the East Coast IDEAS Investor Conference on Wednesday, June 10, 2026 at The Westin Times Square in New York, NY. UFP’s presentation is scheduled to begin at 7:55 AM ET. The presentation is webcast and can be accessed through the conference host’s main website: https://...