
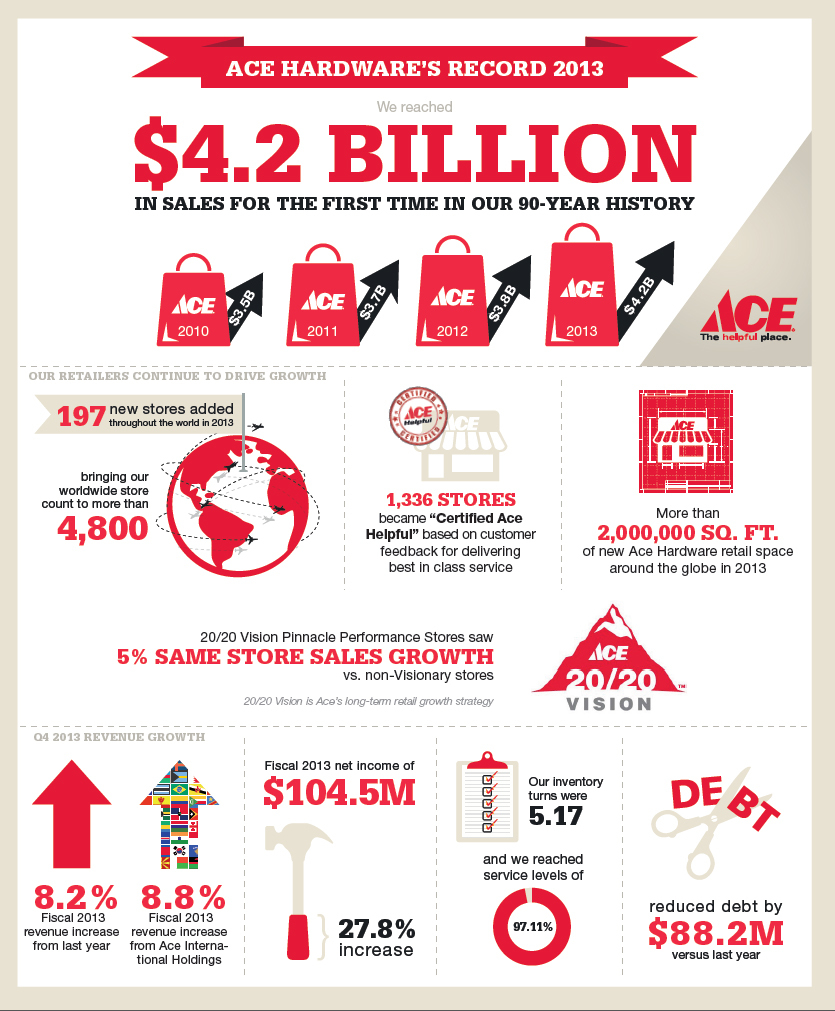
OAK BROOK, Ill.--(BUSINESS WIRE)--Ace Hardware Corporation (“Ace” or the “Company”), the largest retailer-owned hardware cooperative in the industry, today reported total fiscal 2013 revenues of $4.2 billion, an increase of $313.3 million or 8.2 percent. Net income was $104.5 million for fiscal 2013, an increase of $22.7 million or 27.8 percent, compared to $81.8 million in fiscal 2012. The results for fiscal 2013 included a charge of $6.2 million related to the estimated costs to close the Toledo, Ohio Retail Support Center (RSC) while fiscal 2012 included a charge for the loss on the early extinguishment of debt of $19.9 million. The results for fiscal 2012 also included a $7.0 million gain on the sale of paint assets, net of acquisition and disposition costs.
Total revenues for the fourth quarter of 2013 were $1.0 billion, an increase of $110.5 million or 12.1 percent from 2012. Net income was $23.4 million for the fourth quarter of 2013, an increase of $1.0 million or 4.5 percent from the $22.4 million earned in 2012.
“2013 was a record year for the Company," said John Venhuizen, Ace president and chief executive officer. “We outperformed our operating plan, exceeding $4 billion in consolidated revenues and $100 million in net income for the first time in our history. These achievements were the result of the hard work and perseverance of our retailers coupled with the support and dedication of our employees.”
“Ace retailers also had a very good year,” continued Venhuizen. “Comparable store retail sales were up 3.5 percent in the fourth quarter and up 4.3 percent for the year, with 75 percent of retailers surveyed reporting record net profits.”
Comparability of 2013 and 2012 Results
The December 2012 acquisition by Ace of WHI Holdings Corp. (“WHI”), the indirect owner of the 85 store Westlake Ace Hardware retail chain, results in the consolidation of WHI’s financial statements into Ace’s financial statements for 2013. This affects the comparability of the 2013 and 2012 financial statements and results in a reduction of reported wholesale revenues, as wholesale revenues from Ace to WHI are now eliminated. This elimination totaled $83.7 million in wholesale revenues for all of 2013 and $21.6 million for the fourth quarter of 2013.
Revenues
Consolidated revenues for the three months ended December 28, 2013 totaled $1.0 billion, an increase of $110.5 million, or 12.1 percent, as compared to the prior year. Total wholesale revenues were $968.8 million, an increase of $64.9 million, or 7.2 percent, as compared to the prior year. (Excluding the elimination of wholesale revenues to WHI of $21.6 million and $2.2 million in the fourth quarter of 2013 and 2012, respectively, the increase in wholesale revenues would have been $84.3 million, or 9.3 percent.) Increases were noted across the majority of departments with paint supplies, heating & cooling, live goods and outdoor lawn & garden showing the largest increases.
Wholesale merchandise revenues to comparable stores increased $61.4 million in the fourth quarter of 2013 representing a significant portion of the fiscal year’s overall increase in wholesale merchandise revenues. This was primarily driven by revenues recognized from the Paint Studio Initiative and strong sales in the fourth quarter. Wholesale merchandise revenues to new domestic stores activated in the 2012 and 2013 fiscal year periods contributed $27.0 million in incremental revenues during the quarter, while wholesale merchandise revenues decreased $7.6 million due to cancelled stores. Wholesale service revenues were down $0.8 million primarily due to the timing of advertising revenues.
Wholesale revenues by Ace’s international business increased $4.3 million, or 8.3 percent, in the fourth quarter as compared to the prior year primarily as a result of higher revenues to retailers in the Middle East and Latin America markets.
Retail revenues were $53.6 million in the fourth quarter of 2013. This is an increase of $45.6 million from the fourth quarter of 2012 which resulted from the timing of the December 2012 acquisition of WHI. During the fourth quarter, same store sales at WHI’s stores were up 1.5 percent versus the prior year primarily due to an increase in the heating and cooling category.
Consolidated revenues for fiscal 2013 totaled $4.2 billion, an increase of $313.3 million, or 8.2 percent, as compared to the prior year. Total wholesale revenues were $3.9 billion, an increase of $95.7 million, or 2.5 percent, as compared to the prior year. (Excluding the elimination of wholesale revenues to WHI of $83.7 million and $2.2 million in fiscal years 2013 and 2012, respectively, the increase in wholesale revenues would have been $177.2 million, or 4.6 percent.) Increases were noted across the majority of departments with paint supplies & sundries, plumbing, heating & cooling, and live goods showing the largest increases.
Wholesale merchandise revenues to comparable stores increased $95.5 million in fiscal 2013. Wholesale merchandise revenues to new domestic stores activated in the 2012 and 2013 fiscal year periods contributed $91.4 million in incremental revenues during the year, while wholesale merchandise revenues decreased $38.2 million due to cancelled stores. Wholesale service revenues were up $9.3 million primarily due to increased delivery and advertising revenues.
Wholesale revenues by Ace’s international business increased $19.2 million, or 8.8 percent, for fiscal 2013 as compared to fiscal 2012 primarily as a result of higher revenues to retailers in the Middle East and Latin America markets.
Retail revenues were $225.6 million for fiscal 2013. This is an increase of $217.6 million from fiscal 2012, which resulted from the timing of the December 2012 acquisition of WHI. The Company owned WHI for all 52 weeks of 2013 but only the last two weeks of 2012. Same store sales at WHI’s stores were down 0.8 percent primarily due to a decrease in the lawn and garden category in the first and second quarters of 2013.
Ace added 152 new domestic stores and cancelled 85 domestic stores in fiscal 2013 for a net increase in store count of 67. This brought the company’s total domestic store count to 4,171 at the end of 2013.
Gross Profit
Wholesale gross profit for fiscal 2013 was $478.4 million, an increase of $12.5 million from fiscal 2012. Gross margin percentage was 12.2 percent of wholesale revenues in fiscal 2013, flat with 12.2 percent in the prior year.
Retail gross profit was $98.5 million and the retail gross margin percentage was 43.7 percent of retail revenues in fiscal 2013. The increase of $95.3 million from fiscal 2012 was caused by the timing of the December 2012 acquisition of WHI.
Expenses
Wholesale operating expenses increased $12.8 million, or 3.6 percent, for fiscal 2013 as compared to fiscal 2012. The increase primarily resulted from higher employee benefit and salary expenses of $6.3 million and increased advertising expenses of $3.4 million. The Company also recorded a $6.2 million charge for estimated costs related to the announced closure of the Toledo, Ohio RSC in fiscal 2013. Fiscal 2012 was impacted by the $7.0 million gain on sale of paint assets, net of acquisition and disposition costs recorded in fiscal 2012.
The addition of retail operating expenses of $90.6 million in fiscal 2013 was a result of the acquisition of WHI in December 2012. This included approximately $5.9 million of non-cash depreciation and amortization expense for assets and liabilities established as part of the opening balance sheet of WHI.
Interest expense declined $9.8 million, or 41.0 percent, in fiscal 2013 as compared with fiscal 2012. The decline primarily resulted from lower average balances outstanding and lower interest rates. Fiscal 2012 included a charge for the loss on the early extinguishment of debt of $19.9 million, which was a result of the refinancing of the credit facility and the early redemption of the senior secured notes.
Income tax expense increased $1.0 million in fiscal 2013 primarily as a result of the acquisition of WHI.
Balance Sheet
The Company reduced inventory levels by $52.2 million, or 9.4 percent, to $505.5 million at December 28, 2013 from $557.7 million at December 29, 2012. Despite this significant decline, service levels remained in excess of 97 percent for fiscal 2013.
The decrease in inventory levels, along with cash generated from operating activities net of capital spending was used to decrease debt. Total debt, was down $88.2 million from $290.2 million at December 29, 2012 to $202.0 million at December 28, 2013.
Paint Studio Initiative
Ace is in the process of remodeling and re-equipping the paint departments at over 3,000 Ace stores across the U.S. This includes new Ace Paint and Valspar product assortments, color merchandising palettes, state-of-the-art tinting machines, signage and décor that are all part of the new paint department floor plan. Since starting the rollout in early September, over 1,600 stores have had their paint departments remodeled. The Company expects to have over 3,000 stores completed by the time of the grand reopening of the paint business in May 2014.
About Ace Hardware
For 90 years, Ace Hardware has been known as the place with the helpful hardware folks in thousands of neighborhoods across America, providing customers with a more personal kind of helpful. In 2013, Ace ranked “Highest in Customer Satisfaction among Home Improvement Stores for the Seventh Consecutive Year,” according to J.D. Power and Associates. With over 4,800 hardware stores locally owned and operated across the globe, Ace is the largest hardware cooperative in the industry. Headquartered in Oak Brook, Ill., Ace and its subsidiaries currently operate 14 distribution centers in the U.S. and also have distribution capabilities in Shanghai, China; Panama City, Panama; and Dubai, United Arab Emirates. Its retailers’ stores are located in all 50 states, the District of Columbia and approximately 60 countries. For more information on Ace, visit www.acehardware.com.
| ACE HARDWARE CORPORATION | ||||||||||||||||
| CONSOLIDATED STATEMENTS OF INCOME | ||||||||||||||||
| (In millions) | ||||||||||||||||
| Three Months Ended | Years Ended | |||||||||||||||
| December 28, | December 29, | December 28, | December 29, | |||||||||||||
| 2013 | 2012 | 2013 | 2012 | |||||||||||||
| (13 Weeks) | (13 Weeks) | (52 Weeks) | (52 Weeks) | |||||||||||||
| Revenues: | ||||||||||||||||
| Wholesale revenues | $ | 968.8 | $ | 903.9 | $ | 3,928.6 | $ | 3,832.9 | ||||||||
| Retail revenues | 53.6 | 8.0 | 225.6 | 8.0 | ||||||||||||
| Total revenues | 1,022.4 | 911.9 | 4,154.2 | 3,840.9 | ||||||||||||
| Cost of revenues: | ||||||||||||||||
| Wholesale cost of revenues | 856.2 | 802.7 | 3,450.2 | 3,367.0 | ||||||||||||
| Retail cost of revenues | 30.2 | 4.8 | 127.1 | 4.8 | ||||||||||||
| Total cost of revenues | 886.4 | 807.5 | 3,577.3 | 3,371.8 | ||||||||||||
| Gross profit: | ||||||||||||||||
| Wholesale gross profit | 112.6 | 101.2 | 478.4 | 465.9 | ||||||||||||
| Retail gross profit | 23.4 | 3.2 | 98.5 | 3.2 | ||||||||||||
| Total gross profit | 136.0 | 104.4 | 576.9 | 469.1 | ||||||||||||
| Distribution operations expenses | 25.7 | 23.7 | 100.0 | 98.1 | ||||||||||||
| Selling, general and administrative expenses | 38.7 | 33.6 | 142.3 | 138.1 | ||||||||||||
| Retailer success and development expenses | 25.5 | 26.1 | 124.3 | 117.6 | ||||||||||||
| Retail operating expenses | 21.8 | 3.3 | 90.6 | 3.3 | ||||||||||||
| Retail support center closure costs | - | - | 6.2 | - | ||||||||||||
| Gain on sale of paint assets, net of acquisition and disposition costs | - | (7.0 | ) | - | (7.0 | ) | ||||||||||
| Total operating expenses | 111.7 | 79.7 | 463.4 | 350.1 | ||||||||||||
| Operating income | 24.3 | 24.7 | 113.5 | 119.0 | ||||||||||||
| Interest expense | (3.1 | ) | (3.7 | ) | (14.1 | ) | (23.9 | ) | ||||||||
| Loss on early extinguishment of debt | - | - | - | (19.9 | ) | |||||||||||
| Interest income | 1.4 | 1.3 | 3.9 | 4.2 | ||||||||||||
| Other income, net | 0.4 | 1.3 | 6.3 | 6.3 | ||||||||||||
| Income tax (expense) benefit | 0.5 | (1.1 | ) | (4.5 | ) | (3.5 | ) | |||||||||
| Net income | 23.5 | 22.5 | 105.1 | 82.2 | ||||||||||||
| Less: net income attributable to noncontrolling interests | 0.1 | 0.1 | 0.6 | 0.4 | ||||||||||||
| Net income attributable to Ace Hardware Corporation | $ | 23.4 | $ | 22.4 | $ | 104.5 | $ | 81.8 | ||||||||
| Accrued patronage distributions | $ | 17.8 | $ | 18.5 | $ | 100.7 | $ | 75.5 | ||||||||
| Accrued patronage distributions to third party retailers | $ | 16.9 | $ | 18.5 | $ | 98.2 | $ | 75.5 | ||||||||
| ACE HARDWARE CORPORATION | |||||||
| CONSOLIDATED BALANCE SHEETS | |||||||
| (In millions, except share data) | |||||||
| December 28, | December 29, | ||||||
| 2013 | 2012 | ||||||
| Assets | |||||||
| Cash and cash equivalents | $ | 17.9 | $ | 13.1 | |||
| Marketable securities | 53.8 | 54.1 | |||||
| Receivables, net of allowance for doubtful accounts of $9.3 and $7.2, respectively | 335.9 | 296.7 | |||||
| Inventories | 505.5 | 557.7 | |||||
| Prepaid expenses and other current assets | 41.8 | 45.2 | |||||
| Total current assets | 954.9 | 966.8 | |||||
| Property and equipment, net | 324.7 | 320.0 | |||||
| Notes receivable, net of allowance for doubtful accounts of $11.4 and $13.9, respectively | 21.2 | 32.4 | |||||
| Goodwill and other intangible assets | 24.1 | 24.2 | |||||
| Other assets | 63.6 | 69.6 | |||||
| Total assets | $ | 1,388.5 | $ | 1,413.0 | |||
| Liabilities and Equity | |||||||
| Current maturities of long-term debt | $ | 23.4 | $ | 49.5 | |||
| Accounts payable | 491.7 | 505.5 | |||||
| Patronage distributions payable in cash | 39.9 | 30.0 | |||||
| Accrued expenses | 165.9 | 144.8 | |||||
| Total current liabilities | 720.9 | 729.8 | |||||
| Long-term debt | 178.6 | 240.7 | |||||
| Patronage refund certificates payable | 28.4 | 22.6 | |||||
| Other long-term liabilities | 66.3 | 64.8 | |||||
| Total liabilities | 994.2 | 1,057.9 | |||||
| Member Retailers’ Equity: | |||||||
| Class A voting common stock, $1,000 par value, 10,000 shares authorized, 2,764 and 2,736 issued and outstanding, respectively | 2.8 | 2.7 | |||||
| Class C nonvoting common stock, $100 par value, 4,000,000 shares authorized, 3,156,908 and 3,008,903 issued and outstanding, respectively | 315.7 | 300.9 | |||||
| Class C nonvoting common stock, $100 par value, issuable to retailers for patronage distributions, 408,684 and 257,613 shares issuable, respectively | 40.9 | 25.7 | |||||
| Contributed capital | 20.0 | 19.7 | |||||
| Retained earnings (accumulated deficit) | 6.3 | (0.1 | ) | ||||
| Accumulated other comprehensive income (loss) | 0.3 | (1.2 | ) | ||||
| Equity attributable to Ace member retailers | 386.0 | 347.7 | |||||
| Equity attributable to noncontrolling interests | 8.3 | 7.4 | |||||
| Total equity | 394.3 | 355.1 | |||||
| Total liabilities and equity | $ | 1,388.5 | $ | 1,413.0 | |||
| ACE HARDWARE CORPORATION | ||||||||
| CONSOLIDATED STATEMENTS OF CASH FLOWS | ||||||||
| (In millions) | ||||||||
| Years Ended | ||||||||
| December 28, | December 29, | |||||||
| 2013 | 2012 | |||||||
| (52 Weeks) | (52 Weeks) | |||||||
| Operating Activities | ||||||||
| Net income | $ | 105.1 | $ | 82.2 | ||||
| Adjustments to reconcile net income to net cash provided by operating activities: | ||||||||
| Depreciation and amortization | 45.6 | 40.1 | ||||||
| Amortization of deferred gain on sale leaseback | (1.1 | ) | (1.2 | ) | ||||
| Amortization of deferred financing costs | 1.2 | 1.9 | ||||||
| Loss on the disposal of assets, net | - | 0.4 | ||||||
| Provision for doubtful accounts | 3.4 | 2.6 | ||||||
| Loss on early extinguishment of debt | - | 19.9 | ||||||
| Gain on sale of paint assets, net of acquisition and disposition costs | - | (7.0 | ) | |||||
| Retail support center closure costs | 6.2 | - | ||||||
| Other, net | 0.5 | 0.2 | ||||||
| Changes in operating assets and liabilities: | ||||||||
| Receivables | (53.6 | ) | (7.8 | ) | ||||
| Inventories | 52.2 | 24.9 | ||||||
| Other current assets | 6.2 | (4.4 | ) | |||||
| Other long-term assets | (1.1 | ) | (9.9 | ) | ||||
| Accounts payable and accrued expenses | 2.0 | 30.7 | ||||||
| Other long-term liabilities | (0.5 | ) | 1.2 | |||||
| Deferred taxes | 1.9 | 2.9 | ||||||
| Net cash provided by operating activities | 168.0 | 176.7 | ||||||
| Investing Activities | ||||||||
| Purchases of marketable securities | (27.1 | ) | (12.0 | ) | ||||
| Proceeds from sale of marketable securities | 27.6 | 11.0 | ||||||
| Purchases of property and equipment | (45.0 | ) | (46.4 | ) | ||||
| Cash paid for acquired business, net of cash acquired | - | (52.0 | ) | |||||
| Proceeds from sale of paint manufacturing assets | - | 34.8 | ||||||
| Decrease in notes receivable, net | 2.9 | 1.8 | ||||||
| Other | 0.2 | 0.2 | ||||||
| Net cash used in investing activities | (41.4 | ) | (62.6 | ) | ||||
| Financing Activities | ||||||||
| Net (payments) borrowings under revolving lines of credit | (78.6 | ) | 43.6 | |||||
| Proceeds from issuance of long-term debt | - | 200.0 | ||||||
| Redemption of senior notes | - | (301.3 | ) | |||||
| Principal payments on long-term debt | (16.3 | ) | (9.5 | ) | ||||
| Payments of deferred financing costs | (0.7 | ) | (5.2 | ) | ||||
| Payments of cash portion of patronage distribution | (27.1 | ) | (27.7 | ) | ||||
| Payments of patronage refund certificates | (0.1 | ) | (17.4 | ) | ||||
| Proceeds from sale of noncontrolling interests | 0.1 | 0.3 | ||||||
| Other | 0.9 | 0.4 | ||||||
| Net cash used in financing activities | (121.8 | ) | (116.8 | ) | ||||
| Increase (decrease) in cash and cash equivalents | 4.8 | (2.7 | ) | |||||
| Cash and cash equivalents at beginning of period | 13.1 | 15.8 | ||||||
| Cash and cash equivalents at end of period | $ | 17.9 | $ | 13.1 | ||||
| Supplemental disclosure of cash flow information: | ||||||||
| Interest paid | $ | 11.3 | $ | 22.5 | ||||
| Income taxes paid | $ | 1.4 | $ | 1.0 | ||||