Newsroom
Sorted by: Latest
-
Qube Research & Technologies LTD UK Regulatory Announcement: Form 8.3
LONDON--(BUSINESS WIRE)-- FORM 8.3 PUBLIC OPENING POSITION DISCLOSURE/DEALING DISCLOSURE BY A PERSON WITH INTERESTS IN RELEVANT SECURITIES REPRESENTING 1% OR MORE Rule 8.3 of the Takeover Code (the “Code”) 1. KEY INFORMATION (a) Full name of discloser: Qube Research & Technologies Limited (b) Owner or controller of interests and short positions disclosed, if different from 1(a): The naming of nominee or vehicle companies is insufficient. For a trust, the trustee(s), settlor and beneficiari...
-
メアリー・ケイが2026年サステナビリティ・レポートを発表、社会・経済・環境分野で世界的な変革をもたらす進展を強調
ダラス--(BUSINESS WIRE)--(ビジネスワイヤ) -- サステナビリティと女性のエンパワーメントに取り組む世界有数の美容企業であるメアリー・ケイ(Mary Kay Inc.)は、2026年サステナビリティ・レポートを発表しました。同レポートでは、2030年目標に向けた進捗を示すとともに、世界各地で前向きな変化を引き続きもたらしている2025年および直近の成果を紹介しています。 この年次レポートでは、メアリー・ケイが数十年にわたり社会・経済・環境分野のサステナビリティに尽力してきたことを強調しています。これらの分野は、同社の事業戦略と、世界中で「女性の人生を豊かにする」という使命に根差した企業としての歩みにおける中核的な柱です。 「『女性の人生を豊かにする』というメアリー・ケイのコミットメントは、世界中で、あらゆる世代の女性による企業を後押ししながら起業家精神を後押ししながら、当社が事業を運営し、イノベーションを推進し、ビューティー業界全体で持続可能なインパクトを創出する上で、引き続き指針となっています」と、メアリー・ケイの最高経営責任者(CEO)である ライアン・ロジャ...

-
Lincoln National Corporation’s Board of Directors Declares Series C and Series D Preferred Stock Dividends
RADNOR, Pa.--(BUSINESS WIRE)--Lincoln Financial (NYSE: LNC) announced today that the board of directors of Lincoln National Corporation has declared the following preferred stock dividends: Semi-annual dividend of $1,156.25 per share on the corporation’s 9.250% Fixed Rate Reset Non-Cumulative Preferred Stock, Series C, $25,000 liquidation preference per share, represented by depositary shares each representing a 1/25th interest in a share of the preferred stock, holders of which will receive $4...
-
2PointZero Group affiche une montée en puissance à l’échelle mondiale avec un chiffre d’affaires de 21,9 milliards d’AED et un bénéfice net de 7,7 milliards d’AED au premier semestre 2026
ABOU DHABI, Émirats arabes unis--(BUSINESS WIRE)--2PointZero Group (ADX : 2POINTZERO), société holding d’investissement basée à Abou Dhabi, a annoncé ses résultats financiers pour le premier semestre 2026, faisant état d’un chiffre d’affaires de 21,9 milliards d’AED et d’un bénéfice net consolidé de 7,7 milliards d’AED. Cette solide performance se reflète dans un EBITDA ajusté de 5,0 milliards d’AED, calculé après exclusion des variations de juste valeur et des éléments exceptionnels. Le bénéfi...

-
First Trust Global Funds PLC UK Regulatory Announcement: Net Asset Value(s)
LONDON--(BUSINESS WIRE)-- Funds Date TIDM ISIN Code Shares in Issue Currency Net Asset Value NAV/per Share First Trust Vest U.S. Equity Moderate Buffer UCITS ETF - November 30.07.2026 GNOV LN IE000OJ31JQ4 1,000,002.00 USD 36,999,300.31 36.999 ...
-
First Trust Global Funds PLC UK Regulatory Announcement: Net Asset Value(s)
LONDON--(BUSINESS WIRE)-- Funds Date TIDM ISIN Code Shares in Issue Currency Net Asset Value NAV/per Share First Trust Vest U.S. Equity Moderate Buffer UCITS ETF- August 30.07.2026 GAUG LN IE000TGSG3Y5 400,002.00 USD 14,942,903.22 37.357 ...
-
Společnost Mary Kay vydala zprávu o udržitelnosti za rok 2026, která vyzdvihuje transformační pokrok, kterého bylo dosaženo v sociální a ekonomické oblasti a v oblasti environmentální dopadu na celosvětové úrovni
DALLAS--(BUSINESS WIRE)--Mary Kay, přední světová kosmetická společnost, která dbá na udržitelnost a posilování postavení žen, dnes zveřejnila svou zprávu o udržitelnosti za rok 2026, v níž popisuje pokrok při plnění cílů do roku 2030 a oslavuje výsledky za rok 2025 i nejnovější úspěchy, které i nadále celosvětově podněcují pozitivní změny. Výroční zpráva vyzdvihuje desítky let trvající oddanost společnosti Mary Kay věci sociální, ekonomické a environmentální udržitelnosti, která tvoří hlavní p...

-
First Trust Global Funds PLC UK Regulatory Announcement: Net Asset Value(s)
LONDON--(BUSINESS WIRE)-- Funds Date TIDM ISIN Code Shares in Issue Currency Net Asset Value NAV/per Share First Trust Vest U.S. Equity Buffer UCITS ETF - April 30.07.2026 FAPR.LN IE000WX2HZQ7 250,002.00 USD 6,413,146.36 25.652 ...
-
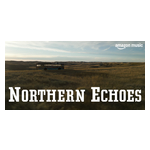
Amazon Music Canada annonce la saison 2 de Northern Echoes
TORONTO--(BUSINESS WIRE)--Aujourd'hui, Amazon Music Canada ouvre les candidatures pour la deuxième saison de Northern Echoes, la série consacrée aux artistes méconnus, dédiée à faire émerger une nouvelle génération de talent canadien. La saison 2 mettra en vedette six artistes, comparativement à quatre lors de sa première année, ce qui élargit davantage l'engagement du programme envers la mise en valeur de talents émergents d'exception. Le programme soutient les artistes issus de communautés so...