Newsroom
Sorted by: Latest
-
NeoGenomics Announces Settlement of Voluntary Disclosure to OIG-HHS
FORT MYERS, Fla.--(BUSINESS WIRE)--NeoGenomics Announces Settlement of Voluntary Disclosure to OIG-HHS...

-
ハリウッド商工会議所、ラグジュアリー・ホスピタリティー分野に進出
カリフォルニア州ハリウッド--(BUSINESS WIRE)--(ビジネスワイヤ) -- 象徴的なハリウッドサイン®とハリウッド・ウォーク・オブ・フェーム®で知られるハリウッド商工会議所は、ザ・シーン・ホテルズ&リゾーツとの戦略的提携を通じてラグジュアリー・ホスピタリティー分野に進出し、ハリウッド・ホテルズ&レジデンシズを立ち上げます。 ホスピタリティー、旅行、ブランド開発の各分野で、通算40年以上にわたる専門的経験を有するザ・シーン・ホテルズ&リゾーツが、ブランドの開発と運営を主導します。この提携を通じて、世界各地の高級ホテルやブランデッド・レジデンスにハリウッドのライフスタイルを取り入れ、世界のエンターテインメントの都であるハリウッドに着想を得た、没入感あふれるデスティネーションを創出します。 「この提携は、単にハリウッドというブランドを拡大するだけのものではなく、ハリウッドをエンターテインメント、創造性、ビジネスの世界を代表する中心地とする私たちのビジョンを反映しています」とハリウッド商工会議所の会頭兼最高経営責任者(CEO)ロン・フライアーソンは述べました。「国際的なパートナ...
-
Empire State Realty Trust Signs 26,134 Square Foot Space with Instacart at 111 W. 33rd Street
NEW YORK--(BUSINESS WIRE)--Empire State Realty Trust, Inc. (NYSE: ESRT) today announced that it signed a new office lease with Instacart – a grocery technology app – for 26,134 square feet at 111 W. 33rd Street in the second quarter. Along with a 7,052 square-foot office lease signed with Hansa Biopharma, Inc. early in the third quarter, 111 W. 33rd Street is now 100% leased. Located steps to Penn Station, Madison Square Garden, and Manhattan’s best dining and lodging, 111 W. 33rd Street featur...
-
Bank of Hope Transforms NYC Manhattan Branch for an Exclusive Experience Through Innovative 'BTS THE CITY ARIRANG NEW YORK' Sponsorship
NEW YORK--(BUSINESS WIRE)--Bank of Hope is turning up the volume on community engagement with a unique activation designed to celebrate and create meaningful and memorable experiences as part of their sponsorship of 'BTS THE CITY ARIRANG NEW YORK' in New York City. “This sponsorship is about far more than music,” said Kevin Kim, Chairman and CEO of Bank of Hope. “Through authentic community engagement, meaningful partnerships, and a shared sense of belonging, BTS THE CITY ARIRANG NEW YORK bring...
-
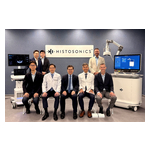
HistoSonics位于香港的扩建组织摧毁术培训中心开业
明尼阿波利斯--(BUSINESS WIRE)--(美国商业资讯)-- HistoSonics今日宣布,其扩建后的组织摧毁术培训中心在香港正式启用,这进一步巩固了香港作为亚洲地区医师教育、临床合作及创新领域领先枢纽的地位。 该中心最初于2025年5月在港怡医院(Gleneagles Hospital Hong Kong)成立,是亚洲首家组织摧毁术培训基地。自成立以来,该中心已接待了来自亚洲各地的医生前来参加实操培训和临床观摩,从而推动了组织摧毁术在亚洲的普及。 扩建后的设施将通过增强实践培训、临床观摩和多学科教育项目的容量,满足日益增长的医师教育需求。医师们接受的相关培训包括患者筛选、治疗方案制定、操作流程以及在各自机构内建立成功的组织摧毁术项目。 自2025年以来,港怡医院一直担任HistoSonics在该地区的医师教育卓越中心。在此基础上,HistoSonics与港怡医院将继续在医师培训、临床研究及未来技术开发等领域深化战略合作。 HistoSonics董事长兼首席执行官Mike Blue表示。“香港在亚洲一直处于组织摧毁术应用和医生培训的前沿。该培训中心的扩建既反映了市场对组织摧...

-
HistoSonics ouvre un plus grand centre de formation en histotripsie à Hong Kong
MINNEAPOLIS--(BUSINESS WIRE)--HistoSonics a annoncé aujourd'hui l'ouverture de son centre agrandi de formation en histotripsie à Hong Kong, renforçant ainsi la position de la ville en tant que pôle d'excellence pour la formation médicale, la collaboration clinique et l'innovation en Asie. Créé initialement en mai 2025 à l'hôpital Gleneagles de Hong Kong, ce centre a été le premier établissement de formation en histotripsie en Asie. Depuis son ouverture, il a accueilli des médecins de toute la r...

-
Calix Releases Second Quarter 2026 Financial Results
SAN JOSE, Calif.--(BUSINESS WIRE)--Calix, Inc. (NYSE: CALX) today announced unaudited financial results for its second quarter of 2026, which have been posted as a letter to stockholders to the investor relations section of its website. Please visit the Calix Investor Relations website at https://investor-relations.calix.com to view the letter to stockholders. A conference call to discuss these results with President and CEO Michael Weening and CFO Cory Sindelar will be held tomorrow, July 21,...
-
HistoSonics eröffnet ein erweitertes Schulungszentrum für Histotripsie in Hongkong
MINNEAPOLIS--(BUSINESS WIRE)--HistoSonics gab heute die Eröffnung seines erweiterten Histotripsy-Schulungszentrums in Hongkong bekannt und festigte damit die Position der Stadt als führender Knotenpunkt für die Fortbildung von Ärzten, klinische Zusammenarbeit und Innovation in Asien. Das Zentrum, das ursprünglich im Mai 2025 im Gleneagles Hospital Hongkong gegründet wurde, war die erste Histotripsy-Schulungseinrichtung in Asien. Seit seiner Eröffnung hat es Ärzte aus der gesamten Region zu prak...
-
Aptar Beauty Launches Next-Generation Auto-Loading Dropper Technology for Easier, More Accurate Skincare Dosing
CRYSTAL LAKE, Ill.--(BUSINESS WIRE)--Aptar Beauty Launches Next-Generation Auto-Loading Dropper Technology for Easier, More Accurate Skincare Dosing...

-
SmartFinancial Announces Results for the Second Quarter 2026, Regular Quarterly Cash Dividend
KNOXVILLE, Tenn.--(BUSINESS WIRE)--SmartFinancial, Inc. ("SmartFinancial" or the "Company"; NYSE: SMBK), today announced net income of $16.3 million, or $0.96 per diluted common share, for the second quarter of 2026, compared to net income of $11.7 million, or $0.69 per diluted common share, for the second quarter of 2025, and compared to prior quarter net income of $13.7 million, or $0.81 per diluted common share. Highlights for the Second Quarter of 2026 Operating earnings1 of $16.3 million,...