

Newsroom
Sorted by: Latest
-
Samenvatting: Solana wordt hoofdsponsor van de World Series of Poker®
LAS VEGAS--(BUSINESS WIRE)--De World Series of Poker (WSOP®), de langstlopende en meest prestigieuze pokertoernooiserie ter wereld, heeft vandaag een unieke samenwerking met de Solana Foundation aangekondigd, waarmee ze cryptovaluta rechtstreeks in de wereldwijde pokerervaring gaan integreren. Vanaf vandaag kunnen spelers tijdens het 57e jaarlijkse zomerevenement in Paris Las Vegas en Horseshoe Las Vegas toernooitickets kopen met Solana, via de betalingsinfrastructuur van MoonPay. Dit is de eer...

-
Solana成为世界扑克系列赛(World Series of Poker®)的冠名赞助商
拉斯维加斯--(BUSINESS WIRE)--(美国商业资讯)-- 作为全球历史最悠久、最负盛名的扑克锦标赛系列,世界扑克系列赛(WSOP®)今日宣布与Solana基金会达成一项开创性的合作,旨在将加密货币直接融入全球扑克体验。 从今天在Paris Las Vegas和Horseshoe Las Vegas举行的第57届年度夏季赛事开始,玩家将能够使用Solana购买锦标赛门票,该功能由MoonPay的支付基础设施提供技术支持。这将是WSOP历史上首次允许玩家直接使用加密货币购买参赛门票。通过利用Solana的技术,这种支付方式将免除所有交易手续费。 这项整合将在今年12月于巴哈马举行的2026年WSOP Paradise赛事中进一步扩展,届时锦标赛获胜者将能够通过Solana以稳定币的形式接收奖金结算,从而实现近乎即时的款项到账,并减少传统国际锦标赛奖金结算中常见的繁琐流程。 作为此次合作的一部分,Solana基金会还将担任2026年世界扑克系列赛及2026年世界扑克系列赛Paradise赛事的官方冠名赞助商。 世界扑克大赛,由Solana发牌 扑克社区长期以来一直处于采用数字货币...
-
Solana成為世界撲克大賽(World Series of Poker®)的冠名贊助商
拉斯維加斯--(BUSINESS WIRE)--(美國商業資訊)-- 全球歷史最悠久、最負盛名的撲克錦標賽系列世界撲克大賽(WSOP®)今日宣布與Solana基金會達成一項開創性的合作,旨在將加密貨幣直接融入全球撲克體驗。 從今天在Paris Las Vegas和Horseshoe Las Vegas舉行的第57屆年度夏季賽事開始,玩家將能夠使用Solana購買錦標賽門票,該功能由MoonPay的支付基礎設施提供技術支援。這將是WSOP歷史上首次允許玩家直接使用加密貨幣購買參賽門票。透過利用Solana的技術,這種支付方式將省去所有交易手續費。 這項整合將在今年12月於巴哈馬舉行的2026年WSOP Paradise賽事中進一步擴充,屆時錦標賽獲勝者將能夠透過Solana以穩定幣的形式接收獎金結算,從而實現近乎即時的款項到賬,並減少傳統國際錦標賽獎金結算中常見的繁瑣流程。 在此次合作中,Solana基金會還將擔任2026年世界撲克大賽及2026年世界撲克大賽Paradise賽事的官方冠名贊助商。 世界撲克大賽,由Solana發牌 撲克社群長期以來一直處於採用數位貨幣的尖端,玩家們因其高...

-
CoreWeave Announces Intention to Offer $3.5 Billion of Senior Notes
LIVINGSTON, N.J.--(BUSINESS WIRE)--CoreWeave, Inc. (Nasdaq: CRWV) (“CoreWeave”) announced today that it intends, subject to market and other customary conditions, to offer $3.5 billion (or euro equivalents) in aggregate principal amount of dollar-denominated and euro-denominated senior notes due 2032 (collectively, the “Notes”) in a private offering. The Notes will be guaranteed on a senior unsecured basis by certain wholly-owned subsidiaries of CoreWeave. CoreWeave intends to use the proceeds...

-
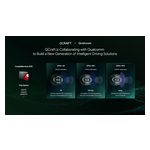
QCraft Demonstrates Urban NOA on Qualcomm's Latest Snapdragon Ride SoC, Targets 2026 Global Mass Production
WUXI, China--(BUSINESS WIRE)--QCraft demonstrated its urban NOA solution on Qualcomm's SA8650P platform in production vehicles, advancing toward global mass production in 2026....
-
Samenvatting: SLB organiseert de 2026 Digital Investor Day
HOUSTON--(BUSINESS WIRE)--SLB (NYSE: SLB) organiseert op woensdag 17 juni 2026 een Investor Day in New York. Op de investeerdersdag zal het management zijn visie geven op de digitale activiteiten van SLB, nu digitale technologieën en AI de energiesector steeds verder hervormen. Tijdens de presentatie ligt de nadruk op de geïntegreerde digitale strategie en het portfolio van SLB. De schaalbare groeimogelijkheden dankzij AI, het het financiële profiel en de vooruitzichten van het bedrijf worden o...
-
Esteban Ocon torna-se embaixador global da Ubigi Travel eSIM
PARIS--(BUSINESS WIRE)--A Ubigi, marca de conectividade eSIM da operadora móvel global Transatel (subsidiária do grupo NTT), anuncia a nomeação do piloto francês Esteban Ocon como embaixador de sua oferta Travel eSIM. A parceria reforça as ambições internacionais da marca e seu compromisso de oferecer a pessoas e empresas uma conectividade 4G/5G de alta performance e acessível em mais de 200 destinos ao redor do mundo. Pioneira em conectividade eSIM global desde 2017, a Ubigi registrou forte cr...
-
Esteban Ocon Named Global Ambassador for Ubigi Travel eSIM Service
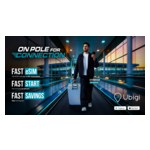
PARIS--(BUSINESS WIRE)--Ubigi, the eSIM connectivity brand of global mobile operator Transatel (a subsidiary of the NTT Group), has chosen French racing driver Esteban Ocon to serve as the face of its Travel eSIM offering. This partnership highlights Ubigi’s international ambitions and reflects the brand’s promise to provide consumers and businesses with high-performance, accessible 4G/5G connectivity in more than 200 destinations worldwide. Launched in 2017, the pioneer in global eSIM connecti...

-
Esteban Ocon wird internationaler Markenbotschafter für Ubigi Travel eSIM
PARIS--(BUSINESS WIRE)--Ubigi, die eSIM-Marke des globalen Mobilfunkbetreibers Transatel (Tochtergesellschaft der NTT-Gruppe), hat den französischen Rennfahrer Esteban Ocon zum Markenbotschafter ihres Travel-eSIM-Angebots ernannt. Diese Partnerschaft unterstreicht die internationalen Ambitionen der Marke und ihr Versprechen, Privatpersonen und Unternehmen leistungsstarke und zugleich erschwingliche 4G/5G-Konnektivität in über 200 Reisezielen weltweit zu bieten. Der 2017 gegründete Pionier der g...

-
ESTEBAN OCON, NOUVEL AMBASSADEUR DU SERVICE TRAVEL ESIM UBIGI À L’INTERNATIONAL
PARIS--(BUSINESS WIRE)--Ubigi, la marque de connectivité eSIM de l’opérateur mobile mondial Transatel (filiale du groupe NTT), a choisi le pilote automobile français Esteban Ocon pour incarner son offre Travel eSIM. Ce partenariat marque les ambitions d’Ubigi à l’international et illustre la promesse de la marque qui offre au grand public comme aux entreprises une connectivité 4G/5G performante et accessible dans plus de 200 destinations à travers le monde. Lancé en 2017, le pionnier de la conn...
