

Newsroom
Sorted by: Latest
-
Logpresso Secures KRW 16 Billion in Series B Funding, Accelerating Shift to AI Security Agents
SEOUL, South Korea--(BUSINESS WIRE)--Logpresso raised KRW 16B in Series B to accelerate its AI security agent model, expand XDR automation, and grow globally with a focus on Japan....
-
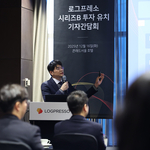
Logpresso、シリーズBで160億ウォン(約17億200万円)を調達し、AIセキュリティ・エージェントへの移行を加速
韓国、ソウル--(BUSINESS WIRE)--(ビジネスワイヤ) -- クラウドネイティブSIEMのリーディングプロバイダーであるLogpresso (創業社長: 梁 烽烈(ヤン・ボンヨル))は、AI駆動型セキュリティ・エージェント・モデルへの移行を推進するため、シリーズBで160億ウォン(約17億200万円)を調達したことを発表しました。 Logpressoは、コンラッド・ソウルで開催した記者会見において、この資金調達ラウンドを発表し、長期的なビジョンと戦略的ロードマップを公開しました。 2013年に設立されたLogpressoは、クラウドSIEM分野のリーダーとして広く認められており、多様な業界に向けて、サイバーセキュリティ、IT運用、不正検知(FDS)向けのセキュリティオペレーション(SecOps)プラットフォーム技術を提供しています。国内外の市場での成功を基盤として、Logpressoは2023年にSaaS型のLogpresso Cloudを発表し、エンタープライズ企業およびスタートアップの顧客から高い信頼を得ています。 シリーズBラウンドには、KB Investment...

-
OAG nomeia Filip Filipov, ex-executivo da Skyscanner, como novo diretor executivo
LONDRES--(BUSINESS WIRE)--A OAG anuncia hoje a nomeação de Filip Filipov, ex-executivo da Skyscanner, como novo diretor executivo. Filip Filipov ocupa atualmente o cargo de diretor de operações (COO) da empresa e sucede Phil Callow, que optou por deixar a função após treze anos de transformação à frente da OAG para se dedicar a outros interesses. Desde que ingressou na empresa em 2024, Filipov desempenhou um papel fundamental na ambiciosa próxima fase de crescimento e aceleração contínua da com...

-
OAG ernennt Ex-Skyscanner-Führungskraft Filip Filipov zum neuen CEO
LONDON--(BUSINESS WIRE)--OAG gibt heute die Ernennung der Ex-Skyscanner-Führungskraft Filip Filipov zum neuen CEO bekannt. Filip Filipov ist derzeitig als Chief Operating Officer des Unternehmens tätig und löst Phil Callow ab, der sich entschieden hat, nach dreizehn Jahren des Wandels an der Spitze von OAG zurückzutreten, um seinen vielen anderen Interessen nachzugehen. Seit seinem Eintritt in das Unternehmen im Jahr 2024 hat Filip Filipov eine führende Rolle in der ehrgeizigen nächsten Phase d...

-
OAG benoemt voormalig leidinggevende bij Skyscanner, Filip Filipov, tot nieuwe Chief Executive Officer
LONDEN--(BUSINESS WIRE)--OAG kondigt vandaag de benoeming aan van Filip Filipov, voormalig leidinggevende bij Skyscanner, tot nieuwe Chief Executive Officer. Filip Filipov is momenteel Chief Operating Officer van het bedrijf en volgt Phil Callow op, die na dertien transformatieve jaren aan het roer van OAG heeft besloten terug te treden om zich te richten op andere interesses. Sinds zijn komst in 2024 heeft Filipov een leidende rol gespeeld in de ambitieuze volgende groeifase en de aanhoudende...

-
OAG nombra a Filip Filipov, exejecutivo de Skyscanner, como nuevo director ejecutivo
LONDRES--(BUSINESS WIRE)--OAG anunció hoy el nombramiento de Filip Filipov, exejecutivo de Skyscanner, como nuevo director ejecutivo. Filip Filipov se desempeña actualmente como director de operaciones de la compañía y sucede a Phil Callow, quien ha decidido retirarse tras trece años transformadores al mando de OAG para dedicarse a otros intereses. Desde su incorporación en 2024, Filipov ha desempeñado un papel central en la ambiciosa nueva etapa de crecimiento de la compañía y en la aceleració...

-
1888 Studios Breaks Ground on New Jersey’s Largest Film & Television Production Campus
BAYONNE, N.J.--(BUSINESS WIRE)--1888 Studios today marked a milestone moment with the groundbreaking of its transformative film and television production campus, set to become the largest purpose-built facility of its kind in New Jersey – and one of the largest in the nation. The development is designed to meet the evolving needs of world-class filmmakers and storytellers, positioning New Jersey at the forefront of the global entertainment industry. “Today marks more than a ceremonial groundbre...

-
Andersen Announces Pricing of Initial Public Offering
SAN FRANCISCO--(BUSINESS WIRE)--Andersen Group Inc. announced the pricing of its initial public offering of 11,000,000 shares of its Class A common stock....

-
OAG任命前Skyscanner高管Filip Filipov为新任首席执行官
伦敦--(BUSINESS WIRE)--(美国商业资讯)-- OAG今日宣布任命前Skyscanner高管Filip Filipov为新任首席执行官。 Filip Filipov目前担任公司首席运营官,他将接替Phil Callow的职位。Phil Callow在OAG掌舵十三年,带领公司实现了变革,如今选择卸任,以追求其他兴趣。自2024年加入OAG以来,Filip Filipov在公司宏伟的阶段性增长计划实施和持续加速发展中发挥了主导作用。他将带领OAG迈入以先进数据产品和人工智能驱动为核心的新时代。在加入OAG之前,Filip Filipov曾在旅游科技和大数据咨询领域担任高级职务,包括任职于Skyscanner的高管团队。 Filip Filipov表示: “能够担任这一职务,领导一家拥有如此深厚底蕴和卓越声誉的公司,我深感荣幸。我对未来的发展充满期待,并将致力于为客户提供他们所倚重的可靠性、服务和创新。” OAG董事长Gehan Talwatte评论道:“Filip的任命体现了我们完善的继任计划以及我们对稳定性、连续性和持续增长的承诺。我们的客户、合作伙伴及整个行业可以期待...

-
Bývalý výkonný ředitel společnosti Skyscanner Filip Filipov byl společností OAG jmenován novým generálním ředitelem
LONDÝN--(BUSINESS WIRE)--Společnost OAG dnes oznámila jmenování Filipa Filipova, bývalého výkonného ředitele společnosti Skyscanner, novým generálním ředitelem. Filip Filipov v současné době působí jako provozní ředitel společnosti a nahrazuje Phila Callowa, který se po třinácti letech transformace v čele společnosti OAG rozhodl odstoupit, aby se mohl věnovat svým mnoha dalším zájmům. Od svého nástupu v roce 2024 hrál Filipov vedoucí roli v ambiciózní další fázi růstu a pokračující akceleraci s...
