

Newsroom
Sorted by: Latest
-
Samenvatting: NEURA Robotics kondigt een recordfinancieringsronde van serie C van maximaal 1,4 miljard dollar aan voor de verdere uitbreiding van 's werelds toonaangevende platform voor fysieke AI
METZINGEN, Duitsland--(BUSINESS WIRE)--NEURA Robotics ("NEURA"), pionier op het gebied van cognitieve robotica en bedenker van het Neuraverse, heeft vandaag een baanbrekende Serie C-financieringsronde aangekondigd ter waarde van maximaal 1,4 miljard dollar. Hiermee wil het de bouw van 's werelds toonaangevende Physical AI-platform in de versnelling zetten. Deze bekendmaking is officieel geldend in de originele brontaal. Vertalingen zijn slechts als leeshulp bedoeld en moeten worden vergeleken m...
-
KBRA Releases Global ABS 2026 Conference: Day 2 Recap
LONDON--(BUSINESS WIRE)--KBRA releases Day 2 recap of the Global ABS 2026 conference held on June 9-11. The agenda for the second day of the Global ABS conference moved from the opening day’s focus on Europe’s securitisation scale-up challenge to how investors, lenders, and issuers are positioning for a more complex market backdrop. Geopolitics set the tone in the morning before discussions turned to relative value, private credit, and the use of structured funding tools to support growth. The...
-
NEURA Robotics annonce une levée de fonds record de série C pouvant atteindre 1,4 milliard de dollars pour accélérer le développement de la première plateforme mondiale d'IA physique
METZINGEN, Allemagne--(BUSINESS WIRE)--NEURA Robotics (« NEURA »), pionnier de la robotique cognitive et créateur du Neuraverse, a annoncé aujourd’hui une levée de fonds historique de série C d’un montant total pouvant atteindre 1,4 milliard de dollars, destinée à accélérer sa mission visant à construire la première plateforme mondiale d’IA physique. Ce financement rassemble des leaders internationaux dans les domaines de l’IA, de la robotique, de l’informatique, de la fabrication et des infras...
-
STALLERGENES GREER PRÉSENTERA DE NOUVELLES DONNÉES DE L’EFFICACITÉ CLINIQUE À LONG TERME DE L’IMMUNOTHÉRAPIE ALLERGÉNIQUE AU EAACI 2026
BAAR, Suisse--(BUSINESS WIRE)--Stallergenes Greer présentera de nouvelles données de l'efficacité clinique à long terme de l'immunothérapie allergénique au EAACI 2026....
-
Stallergenes Greer Will Present New Evidence on Long-term Outcomes in Allergen Immunotherapy at EAACI 2026
BAAR, Switzerland--(BUSINESS WIRE)--Stallergenes Greer will present new evidence on long-term outcomes in allergen immunotherapy at EAACI 2026....

-
Computershare Trustees (Jersey) Limited UK Regulatory Announcement: Form 8.3
LONDON--(BUSINESS WIRE)-- FORM 8.3 PUBLIC OPENING POSITION DISCLOSURE/DEALING DISCLOSURE BY A PERSON WITH INTERESTS IN RELEVANT SECURITIES REPRESENTING 1% OR MORE Rule 8.3 of the Takeover Code (the “Code”) 1. KEY INFORMATION (a) Full name of discloser: Computershare Trustees (Jersey) Limited as trustee of the Schroders Employee Benefit Trust (b) Owner or controller of interests and short positions disclosed, if different from 1(a): The naming of nominee or vehicle companies is insufficient. Fo...
-
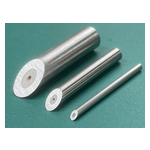
NIPPON KINZOKU’s “FINE PIPE” Series Welded Drawn Pipes Outperforming Seamless Pipes
TOKYO--(BUSINESS WIRE)--NIPPON KINZOKU CO., LTD. (TOKYO:5491) (Headquarters: Minato-ku, Tokyo) has commercialized its “FINE PIPE” series *1, -welded drawn pipes that outperform traditional seamless pipes. By leveraging its unique expertise as a material manufacturer and proprietary processing technologies (welding, drawing, and annealing), the company delivers high-quality, eco-friendly, and cost-effective solutions. FINE PIPE is already widely adopted across various sectors, including automoti...
-
Northern Trust Asset Management Launches Sustainable Multifactor Funds
LONDON--(BUSINESS WIRE)--Northern Trust Asset Management, a leading global investment manager with US$1.4 trillion in assets under management (as of March 31, 2026), today announced the launch of two actively managed UCITS funds, designed to pursue outperformance while efficiently managing climate transition-related risks and opportunities. The NT World Multifactor Focus Select Fund seeks excess returns over a full market cycle, while the NT World Multifactor Select Fund strategy aims to delive...
-
Overture Life and Tekservis Partner, Deploying Automated Egg and Embryo Freezing Across Turkey's Fertility Clinics
PALO ALTO, Calif. & ANKARA, Turkey--(BUSINESS WIRE)--Overture Life, a leading developer of automated IVF technologies and the first company to achieve live births from both robotic fertilization and robotic egg freezing, today announced a nationwide commercial partnership with Tekservis to deploy its DaVitri automated egg and embryo freezing platform across fertility clinics in Turkey. The rollout marks one of the first large-scale implementations of IVF automation at a national level and provi...
-
Wolters Kluwer launches a3innuva Nómina Expert AI in Spain, introducing an intelligent agent embedded in payroll software
BARCELONA, Spain--(BUSINESS WIRE)--Wolters Kluwer launches a3innuva Nómina Expert AI in Spain, introducing an intelligent agent embedded in payroll software...