

Newsroom
Sorted by: Latest
-
Walmart Raises Annual Dividend to $0.99 per Share, Marking 53rd Consecutive Year of Dividend Increases
BENTONVILLE, Ark.--(BUSINESS WIRE)--The Board of Directors of Walmart Inc. (Nasdaq: WMT) approved an annual cash dividend for fiscal year 2027 of $0.99 per share. This represents a 5 percent increase from the $0.94 per share paid for the last fiscal year. The fiscal year 2027 annual dividend of $0.99 per share will be paid in four quarterly installments of $0.2475 per share, according to the following record and payable dates: Record Dates Payable Dates March 20, 2026 April 6, 2026 May 8, 2026...

-
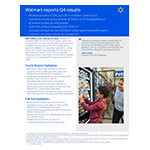
Walmart reports revenue growth of 5.6%, up 4.9% in constant currency (cc)
BENTONVILLE, Ark.--(BUSINESS WIRE)--Walmart Inc. (Nasdaq: WMT): Fourth Quarter Highlights: Revenue of $190.7 billion, up 5.6%, or 4.9% (cc) Global eCommerce sales grew 24%, led by store-fulfilled pickup & delivery and marketplace Global advertising business up 37%, including VIZIO; Walmart Connect in the U.S. up 41% Membership fee revenue grew 15.1% globally Gross margin rate up 13 bps, led by Walmart U.S. Operating income up $0.8 billion, or 10.8% up 10.5% adjusted (cc), growing faster tha...
-
Leo Expands Service Offering Through Investments in Bevara Building Services and Blackfin
PEWAUKEE, Wis.--(BUSINESS WIRE)--Leo, a network of expert facilities management service providers, announced today that it has partnered with Bevara Building Services (“Bevara”) and Blackfin, two industry-leading providers of dedicated on-site building engineers. Leo is building a national facility service business by partnering with exceptional companies and supplying the resources needed to fuel their next chapter of growth. Founded in 1996 in Pewaukee, WI, Bevara is committed to delivering h...

-
Cushman & Wakefield Reports Financial Results for the Fourth Quarter and Full Year 2025
NEW YORK--(BUSINESS WIRE)--Cushman & Wakefield Ltd. (NYSE: CWK) today reported financial results for the fourth quarter and full year of 2025. “Our fourth quarter results capped off an exceptional year for Cushman & Wakefield. In 2025, we drove 34% adjusted earnings per share growth, improved cash flow by more than $125 million and prepaid $300 million in debt,” said Michelle MacKay, Chief Executive Officer of Cushman & Wakefield. “Commercial real estate end markets are healthy, sup...
-
N-able Announces Fourth Quarter and Full-Year 2025 Results
BURLINGTON, Mass.--(BUSINESS WIRE)--N-able, Inc. (NYSE:NABL), a global cybersecurity company delivering business resilience, today reported results for its fourth quarter ended December 31, 2025. “We enter 2026 with momentum following another year of profitable growth and with confidence that we can drive continued strong performance,” said N-able president and CEO John Pagliuca. “Cybersecurity is a matter of survival and our AI-powered cybersecurity platform delivers the business resilience cu...
-
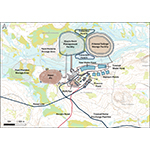
Ausenco Selected to Lead Feasibility Study & Ikkari Project Update
TORONTO--(BUSINESS WIRE)--Rupert Resources Ltd (TSX: RUP, OTCQX: RUPRF, FSE:R05) (“Rupert” or the “Company”) is pleased to announce it has appointed Ausenco Engineering (“Ausenco”) to lead the feasibility study and provides an update on progress at Ikkari, a high-quality, multi-million ounce gold development project located in Northern Finland. HIGHLIGHTS Ausenco appointed to lead the Ikkari Project Feasibility Study (“FS”) Project layout finalised and aligned with Pre-Feasibility Study (“PFS”)...
-
HASI Prices $600 Million Offering of Green Junior Subordinated Notes
ANNAPOLIS, Md.--(BUSINESS WIRE)--HA Sustainable Infrastructure Capital, Inc. (“HASI,” “our,” “we,” or the “Company”) (NYSE: HASI), a leading investor in sustainable infrastructure assets, announced that yesterday, on February 18, 2026, it priced its registered public offering of $600 million in aggregate principal amount of 7.125% green junior subordinated notes due 2056 (the “Notes”). At issuance, the Notes will be guaranteed on a subordinated basis by Hannon Armstrong Sustainable Infrastructu...
-
Coforge Advances EvolveOps.AI: Agentic AI-Powered IT Operations Platform for Mission Zero Resiliency from Edge to Cloud
PRINCETON, N.J.--(BUSINESS WIRE)--Coforge Limited announced key advances of EvolveOps.AI, a next-generation agentic AI-powered IT operations management platform....
-
K1x Named a Finalist in the Thirteenth Family Wealth Report Awards 2026
MORRISTOWN, N.J.--(BUSINESS WIRE)--K1x, a leading tax automation software provider for the North American family office and family wealth industry, has been selected as a finalist in the following category at the Thirteenth Family Wealth Report Awards 2026: Innovative Use of AI The annual Family Wealth Report Awards celebrate innovation and excellence among the firms, teams, and individuals serving North America’s family office, family wealth, and trusted advisor communities. These prestigious...
-
FTV Capital Announces Promotion of Adam Hallquist to Partner
NEW YORK & SAN FRANCISCO--(BUSINESS WIRE)--FTV Capital, a leading sector-focused growth equity investment firm, today announced the promotion of Adam Hallquist to partner. He will lead investments in FTV Ascend with a continued focus on vertical software, payments and financial technology and services. Since joining FTV in 2014, Hallquist has built an extensive track record of sourcing, executing and supporting investments across vertical software and financial technology and services, helping...