

Newsroom
Sorted by: Latest
-
Samenvatting: PUMA brengt NITRO™ naar het voetbal met de PUMA NITRO Lab in Los Angeles
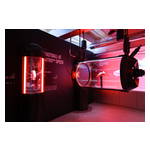
LOS ANGELES--(BUSINESS WIRE)--Het internationale sportmerk PUMA opende vandaag de PUMA NITRO™ Lab in Los Angeles, het nieuwste hoofdstuk van zijn innovatieplatform en het belangrijkste van het bedrijf tot nu toe. Dit markeert de wereldwijde onthulling van de komst van de Ultra Nitro 7 en NITRO™, voor de eerste keer in voetbal op een voetbalschoen. Vorige edities van de NITRO™ Lab in Parijs, Tokio en Londen verkenden de toekomst van loopprestaties en bevestigden NITRO™ als bepalende technologie...

-
Resumen: Pleo anuncia nuevas funciones agénticas, que transformarán la gestión financiera y la toma de decisiones
LONDRES--(BUSINESS WIRE)--Pleo, la primera plataforma de finanzas estratégicas de Europa y la que goza de mayor confianza, anuncia hoy el lanzamiento de un conjunto de agentes de IA que se encargan de gestionar de forma autónoma los gastos rutinarios, de modo que los responsables financieros puedan centrarse en la toma de decisiones en lugar de en las tareas administrativas. Los equipos financieros se ven sometidos a una presión cada vez mayor: el 45 % de las empresas europeas afirma que sus pr...
-
Securities Fraud Investigation Into The Ensign Group, Inc. (ENSG) Continues – Shareholders Who Lost Money Urged To Contact The Law Offices of Frank R. Cruz
LOS ANGELES--(BUSINESS WIRE)--The Law Offices of Frank R. Cruz continues its investigation of The Ensign Group, Inc. (“Ensign” or the “Company”) (NASDAQ: ENSG) on behalf of investors concerning the Company’s possible violations of federal securities laws. IF YOU ARE AN INVESTOR WHO LOST MONEY ON THE ENSIGN GROUP, INC. (ENSG), CLICK HERE TO INQUIRE ABOUT POTENTIALLY PURSUING A CLAIM TO RECOVER YOUR LOSS. What Is The Investigation About? On June 8, 2026, investment media group Hunterbrook Media p...
-
PUMA traz o NITRO™ para o futebol com o PUMA NITRO Lab em Los Angeles
LOS ANGELES--(BUSINESS WIRE)--A marca global de artigos esportivos PUMA inaugurou hoje o PUMA NITRO™ Lab em Los Angeles, o capítulo mais recente de sua plataforma de inovação e o mais significativo da empresa até o momento, marcando o lançamento global do Ultra Nitro 7 e a chegada do NITRO™ ao futebol pela primeira vez em uma chuteira. Edições anteriores do NITRO™ Lab em Paris, Tóquio e Londres exploraram o futuro do desempenho na corrida e consolidaram o NITRO™ como a tecnologia que define a c...

-
PicS N.V. (PICS) Investors: August 4, 2026, Deadline in Securities Fraud Class Action Lawsuit – Contact Kessler Topaz Meltzer & Check, LLP
RADNOR, Pa.--(BUSINESS WIRE)--Kessler Topaz Meltzer & Check, LLP (www.ktmc.com), a nationally recognized securities litigation law firm, informs investors that a securities fraud class action lawsuit has been filed against PicS N.V. (PicS) (NASDAQ: PICS) on behalf of those who purchased or acquired PicS Class A common stock pursuant and/or traceable to PicS’s January 30, 2026 IPO. The lawsuit is filed in the United States District Court for the Southern District of New York and is captioned...
-
PUMA bereichert den Fußball mit NITRO™ und präsentiert in Los Angeles das PUMA NITRO Lab
LOS ANGELES--(BUSINESS WIRE)--Die globale Sportmarke PUMA hat heute in Los Angeles das PUMA NITRO™ Lab eröffnet – die neueste und bislang bedeutendste Initiative der Innovationsstrategie des Unternehmens. Dabei wird der Ultra Nitro 7 weltweit vorgestellt - der erste Fußballschuh mit NITRO™-Technologie. Bei früheren Veranstaltungen des NITRO™ Lab in Paris, Tokio und London wurde die Zukunft der Laufleistung erforscht und NITRO™ als die maßgebliche Technologie im Top-Laufsport mit Fast-3 etablier...

-
Luskin Orthopaedic Institute for Children (LuskinOIC) Innovation +Access Gala Honored UCLA Health Sarcoma Team and Everychild Foundation
LOS ANGELES--(BUSINESS WIRE)--Luskin Orthopaedic Institute for Children (LuskinOIC) Innovation +Access Gala Honored UCLA Health Sarcoma Team and Everychild Foundation...

-
U-Haul Offers Disaster Relief to Chicagoland Residents During Severe Storms
CHICAGO--(BUSINESS WIRE)--Five U-Haul® Companies across the Chicagoland area are offering 30 days of free self-storage and U-Box® container use at 60 U-Haul stores for residents who have been, or stand to be, impacted by the severe weather slamming the region this week. Fast-moving storms packing high winds swept through parts of the Midwest on Wednesday. Chicago and neighboring communities saw property damage, power outages, downed trees and flash flooding. More dangerous storms are forecasted...
-
PUMA fait entrer la technologie NITRO™ dans le monde du football avec le PUMA NITRO™ Lab à Los Angeles
LOS ANGELES--(BUSINESS WIRE)--La marque sportive mondiale PUMA a inauguré aujourd’hui le PUMA NITRO™ Lab à Los Angeles, dernier volet en date de sa plateforme d’innovation et le plus ambitieux à ce jour, marquant ainsi le lancement mondial de l’Ultra Nitro 7 et l’arrivée de la technologie NITRO™ dans le monde du football pour la première fois sur une chaussure de football. Les éditions précédentes du NITRO™ Lab à Paris, Tokyo et Londres ont exploré l’avenir de la performance en course à pied et...
-
AM Best Assigns Issue Credit Ratings to Ameriprise Financial, Inc.’s New Senior Unsecured Notes
OLDWICK, N.J.--(BUSINESS WIRE)--AM Best has assigned a Long-Term Issue Credit Rating of “a-” (Excellent) to Ameriprise Financial, Inc.’s (Ameriprise) (Minneapolis, MN) recently announced USD 300 million, 4.8% senior unsecured notes, due 2031, and the USD 450 million, 5.35% senior unsecured notes, due 2036. The outlook assigned to these Credit Ratings (ratings) is stable.Proceeds from the offering are being used for general corporate purposes, including the repayment of outstanding senior notes m...