Newsroom
Sorted by: Latest
-
Echodyne anuncia una integración con ATAK para la plataforma de radar MESA®
KIRKLAND, Washington--(BUSINESS WIRE)--Echodyne, la empresa de plataformas de radar líder, anunció hoy la disponibilidad de un complemento de kit de conocimiento situacional para Android (ATAK) para su plataforma de radar MESA®. La integración permite que los usuarios configuren, controlen y visualicen datos de los radares Echodyne dentro del entorno ATAK, para respaldar operaciones militares, de seguridad pública y de vigilancia que dependen de TAK para el conocimiento situacional compartido....

-
Echodyne annuncia l'integrazione ATAK per la piattaforma radar MESA®
KIRKLAND, Washington--(BUSINESS WIRE)--Echodyne, l'azienda produttrice di piattaforme radar, ha annunciato oggi la disponibilità di un plugin Android Team Awareness Kit (ATAK) per la sua piattaforma radar MESA®. L'integrazione consente agli utenti di configurare, controllare e visualizzare i dati dai radar Echodyne all'interno dell'ambiente ATAK, a sostegno di operazioni militari, sicurezza pubblica e operazioni di sicurezza che si affidano a TAK per la consapevolezza situazionale condivisa. Il...

-
River City Bank Reports Net Income of $19.6 Million for the Second Quarter of 2026 and a Quarterly Cash Dividend
SACRAMENTO, Calif.--(BUSINESS WIRE)--River City Bank ("the Bank") reported net income of $19.6 million or $1.37 per share for the quarter ended June 30, 2026, which compares to $15.4 million, or $1.05 per share, for the same period in 2025. Net income was $37.6 million or $2.60 per share for the six months ended June 30, 2026, which compares to $27.7 million, or $1.89 per share, for the six months ended June 30, 2025. The Bank’s earnings for the quarter ended June 30, 2026 resulted in a 13.92%...

-
Echodyne gibt die Integration von ATAK in die MESA®-Radarplattform bekannt
KIRKLAND, Wash.--(BUSINESS WIRE)--Echodyne, Anbieter von Radarplattformen, gab heute die Verfügbarkeit eines Android Team Awareness Kit (ATAK)-Plugins für seine MESA®-Radarplattform bekannt. Die Integration ermöglicht es Anwendern, Daten von Echodyne-Radargeräten innerhalb der ATAK-Umgebung zu konfigurieren, zu steuern und zu visualisieren. Damit werden militärische Einsätze sowie Einsätze im Bereich der öffentlichen Sicherheit und des Schutzes unterstützt, die auf TAK für ein gemeinsames Lageb...

-
Samsung présente sa toute nouvelle gamme de produits pliables : Galaxy Z Fold8 Ultra, Fold8 et Flip8
LONDRES--(BUSINESS WIRE)--Samsung Electronics Co., Ltd. a dévoilé aujourd’hui la nouvelle gamme Galaxy Z, une gamme élargie qui offre les appareils pliables à un nouveau public. Cette gamme marque l’arrivée d’un tout nouveau format avec le Galaxy Z Fold8, une nouvelle expérience pliable pensée pour la façon dont les utilisateurs explorent, découvrent et s’immergent dans leurs contenus préférés. La gamme comprend également le Galaxy Z Fold8 Ultra, qui transpose le célèbre standard Ultra de Galax...

-
Samsung Introduces All-New Foldable Lineup: Galaxy Z Fold8 Ultra, Fold8 and Flip8
LONDON--(BUSINESS WIRE)--Samsung Electronics Co., Ltd. today unveiled the new Galaxy Z series, an expanded lineup that brings foldables to a new audience. This series marks the debut of a fresh and exciting form factor in Galaxy Z Fold8, a new kind of foldable experience built around the way people explore, discover, and get immersed in their favourite content. The lineup also includes Galaxy Z Fold8 Ultra, which brings Galaxy’s renowned Ultra standard to foldables with maximum productivity and...

-
Eaton declares quarterly dividend payable August 28, 2026
DUBLIN--(BUSINESS WIRE)--The Board of Directors of intelligent power management company Eaton (NYSE:ETN) today declared a quarterly dividend of $1.10 per ordinary share. The dividend is payable August 28, 2026, to shareholders of record at the close of business on August 7, 2026. Eaton has paid dividends on its shares every year since 1923. Eaton is an intelligent power management company dedicated to protecting the environment and improving the quality of life for people everywhere. We make pr...

-
LGIS Relaunches Around Patented Insurance Solution for Commercial Real Estate Credit Risk
ATLANTA--(BUSINESS WIRE)--Loan Guaranty Insurance Services (LGIS) today announced the relaunch of the company around a singular mission: helping commercial real estate lenders better manage credit risk through innovative insurance solutions. At the center of the company's renewed focus is Commercial Property Loan Insurance (CPLI™), a patented, investment grade-rated loan guarantee insurance product that protects against foreclosure loan losses while helping lenders improve capital efficiency, m...

-
Critical Start Appoints Francine Geist as Chief Executive Officer
PLANO, Texas--(BUSINESS WIRE)--Critical Start appoints veteran software executive Francine Geist as CEO to advance its AI-accelerated, human-validated MDR and SOC AI platform....
-
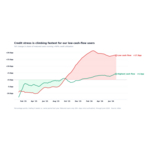
Atlas x Pave Consumer Health Index: Paychecks Hold Steady as Household Financial Cushions Erode to Two-Year Low
SAN FRANCISCO--(BUSINESS WIRE)--Atlas x Pave Consumer Health Index: incomes steady for a sixth quarter, but U.S. households are on their thinnest cushion in two years....