Newsroom
Sorted by: Latest
-
Chevron Awarded Four Offshore Leases for Greece Exploration Blocks
HOUSTON--(BUSINESS WIRE)--Chevron Corporation (NYSE: CVX), via its four Dutch subsidiaries, together with HELLENiQ ENERGY has today signed Lease Agreements with the Hellenic Republic which will enable exploration of four blocks offshore Greece. The blocks are located south of Crete (South Crete 1, South Crete 2) and within the Peloponnese (South of Peloponnese, and Block A2). The awarded consortium, in which Chevron holds a 70% operating interest and HELLENiQ ENERGY a 30% interest, was selected...
-
SkyWater Strengthens Commercial Leadership with Appointment of Christine Dunbar
BLOOMINGTON, Minn.--(BUSINESS WIRE)--SkyWater Technology (NASDAQ: SKYT), the largest exclusively U.S.-based pure-play semiconductor foundry, today announced the appointment of Christine Dunbar as senior vice president of sales and solutions engineering, reporting directly to President and COO John Sakamoto. In her role, Dunbar will focus on accelerating customer acquisition and scaling growth across the company’s core platforms. She joins as SkyWater continues to build on its commercial momentu...
-
Chronus Launches Change Adoption Solution to Help Organizations Tackle the Human Side of Change
SEATTLE--(BUSINESS WIRE)--Chronus, a next-level mentoring and connection platform for the future of work, today announced the launch of its Change Adoption solution....

-
QXO Announces 13 Veteran Recipients of New Roofs
GREENWICH, Conn.--(BUSINESS WIRE)--QXO Inc. (NYSE: QXO) today announced the 13 grand-prize winners of its annual QXO for Veterans initiative, a North American program that honors veterans, Gold Star Families and organizations that serve veterans by providing essential home improvements that restore security, dignity and peace of mind. "As an army veteran myself, it's a privilege for the QXO team to honor the service of these 13 veterans and organizations by providing the security and protection...
-
Bring IT Named Celigo Partner of the Year 2026
DURHAM, N.C.--(BUSINESS WIRE)--Bring IT, a global cloud ERP consulting, implementation, and integration leader, announced today that it has been named the 2026 Partner of the Year by Celigo, a leading enterprise integration platform-as-a-service (iPaaS) provider. Celigo‘s Partner of the Year recognition is awarded to partners that demonstrate excellence in delivering on the platform’s promise to transform fragile workflows into unified automation with a platform built for the AI era. Bring IT h...
-
Titan America to Participate in the Citi 2026 Global Industrial Tech and Mobility Conference
NORFOLK, Virginia--(BUSINESS WIRE)--Titan America SA (NYSE: TTAM) (“Titan America”), a leading fully-integrated producer and supplier of building materials, services and solutions in the construction industry operating along the U.S. East Coast, today announced that it will participate in the Citi 2026 Global Industrial Tech and Mobility Conference in Miami, FL, on Wednesday, February 18, 2026. About Titan America SA Titan America is a leading vertically-integrated producer of cement and buildi...
-
QXO annonce 13 vétérans bénéficiaires d’une nouvelle toiture
GREENWICH, Conn.--(BUSINESS WIRE)--QXO Inc. (NYSE: QXO) a annoncé aujourd’hui les 13 grands gagnants de son initiative annuelle QXO pour les vétérans, un programme nord-américain qui rend hommage aux vétérans, aux familles Gold Star et aux organismes au service des vétérans en leur offrant des améliorations résidentielles essentielles visant à rétablir la sécurité, la dignité et la tranquillité d’esprit. « En tant que vétéran de l’Armée moi-même, c’est un privilège pour l’équipe QXO d’honorer l...
-
Estithmar Holding crée « Estithmar Capital » pour la gestion d'investissements financiers
DOHA, Qatar--(BUSINESS WIRE)--Estithmar Holding Q.P.S.C. a annoncé aujourd'hui la création de son cinquième groupe, « Estithmar Capital », une étape stratégique visant à consolider son expansion et à diversifier ses secteurs d'activité. Estithmar Capital se spécialisera dans la gestion d'investissements financiers, le renforcement de la gouvernance institutionnelle et l'exploitation, dans le respect de cadres clairs en matière de conformité, de réglementation et de gestion des risques, reflétan...

-
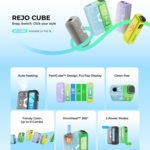
REJO、モジュール型デバイス「CUBE」を日本で世界初公開
TOKYO--(BUSINESS WIRE)--(ビジネスワイヤ) -- 加熱式(HNB)ソリューションの世界的な先駆的プロバイダーであるREJOはこのたび、同社の最新モジュール型HNBデバイス「REJO CUBE」を日本で世界初公開したと発表しました。 従来のHNBデバイスの設計概念から脱却した「REJO CUBE」は、トレンド志向のデザインとデュアルモード吸引体験を特徴とする新たなデバイスとして、2月16日より日本の主要Eコマース販売チャネルで発売されます。 今回の発売は、2025年7月に日本で導入された「REJO Mate Air」に続く同ブランドの最新の取り組みとなります。同デバイスは、コンパクトなデザイン、なめらかな吸い心地、そして「Puff Twice」機能により、日本の成人ユーザーから幅広い評価を得ました。 「REJO CUBE」は、ユーザー体験を研究開発の中核に据えるというREJOの継続的な取り組みを体現する製品です。モジュール設計によるキットの柔軟性、インタラクティブ機能による高いユーザーエンゲージメント、そして市場に流通するほぼすべての交換式スティックに対応するプ...