Newsroom
Sorted by: Latest
-
Die Telekom Srbija Group verkündet Platinum Sponsorship der EXPO 2027 Belgrad
BELGRAD, Serbien--(BUSINESS WIRE)--Die Telekom Srbija Group hat heute ihre Platinum Sponsorship der EXPO 2027 Belgrad bekannt gegeben und damit einen wichtigen Meilstein in Bezug auf die nachhaltige Führungsrolle des Unternehmens im Bereich digitale Innovation und Infrastruktur in der gesamten Region gesetzt. Als Platinum Sponsor wird Telekom Srbija eine zentrale Rolle bei der Bereitstellung des digitalen Grundgerüsts der EXPO 2027 spielen und die Konnektivität sowie die hochmoderne technologis...

-
Barco Products Expands Traffic Safety Line with New BABA-Compliant Solutions
BATAVIA, Ill.--(BUSINESS WIRE)--Barco Products, a leading supplier of high-quality site furnishings and traffic safety equipment, has introduced a new line of BABA-compliant recycled rubber speed bumps and wheel stops designed to meet Buy America, Build America (BABA) standards. The new lineup includes the Standard Recycled Rubber Speed Bump Kit, Speed Bump Sections, End Caps, and Wheel Stops. These products are engineered for exceptional durability, made from 100% recycled rubber, and manufact...

-
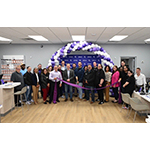
New Xfinity Store Opens in South Bend
SOUTH BEND, Ind.--(BUSINESS WIRE)--Comcast today announced the opening of a new Xfinity Store in South Bend, Indiana, at 4615 Miami Street near the Erskine Village Shopping Center. The company marked the grand opening on February 19 with a ribbon-cutting ceremony joined by South Bend Mayor James Mueller, the South Bend Regional Chamber of Commerce, and a host of city officials and community organizations. The new Xfinity storefront in South Bend features an interactive design that allows visito...
-
NASDAQ: PYPL: Kessler Topaz Meltzer & Check, LLP Announces the Filing of a Securities Fraud Class Action Lawsuit Against PayPal Holdings, Inc.
RADNOR, Pa.--(BUSINESS WIRE)--Kessler Topaz Meltzer & Check, LLP (www.ktmc.com), a nationally recognized securities litigation law firm, informs investors that a securities fraud class action lawsuit has been filed against PayPal Holdings, Inc. (PayPal) (NASDAQ: PYPL) on behalf of those who purchased or acquired PayPal common stock between February 25, 2025, and February 2, 2026, inclusive. The lawsuit is filed in the United States District Court for the Northern District of California and...
-
IntegraGen : Chiffre d’affaires annuel 2025 de 5 M€, trésorerie disponible de 1,1 M€ au 31 décembre 2025 et poursuite du recentrage stratégique sur les études cliniques biopharma
EVRY, France--(BUSINESS WIRE)--Regulatory News : IntegraGen (FR0010908723 – ALINT – Eligible PEA PME), une société spécialisée dans la génomique du cancer et des maladies génétiques rares, qui réalise des analyses génomiques et de données, interprétables pour des laboratoires académiques et privés, annonce aujourd'hui son chiffre d’affaires non audité pour l’exercice 2025 et fait un point d’étape sur sa transformation stratégique. Le chiffre d’affaires non audité d’IntegraGen au titre de l’exer...
-
Big River Steel LLC, BRS Finance Corp. and BRS Intermediate Holdings LLC Announce Cash Tender Offers and Consent Solicitations
PITTSBURGH--(BUSINESS WIRE)--United States Steel Corporation (“U. S. Steel”) announced today that its subsidiaries, Big River Steel LLC, a Delaware limited liability company (“Big River”), BRS Finance Corp., a Delaware corporation (“BRS Finance”) and BRS Intermediate Holdings LLC, a Delaware limited liability company (“BRS Intermediate” and, together with Big River and BRS Finance, the “Company”), has commenced cash tender offers (collectively, the "Tender Offers," and each offer to purchase a...
-
AM Best Upgrades Credit Ratings for RLI Corp. and Its Subsidiaries
OLDWICK, N.J.--(BUSINESS WIRE)--AM Best has upgraded the Financial Strength Rating (FSR) to A++ (Superior) from A+ (Superior) and the Long-Term Issuer Credit Ratings (Long-Term ICR) to “aa+” (Superior) from “aa” (Superior) for the members of RLI Group (RLI). In addition, AM Best has upgraded the Long-Term ICR to “a+” (Excellent) from “a” (Excellent) of RLI’s publicly traded parent holding company, RLI Corp. [NYSE: RLI]. The outlook of these Credit Ratings (ratings) has been revised to stable fr...
-
Saba Capital and Cox Capital Partners Disclose Intention to Commence Tender Offer for Shares of Several Blue Owl BDCs
NEW YORK--(BUSINESS WIRE)--Saba Capital Management, L.P. (together with certain of its affiliates, “Saba”) and Cox Capital Partners (“Cox”) (together with Saba, the “Purchasers”) today disclosed that they provided notice to Blue Owl Capital Corporation II (“OBDC II”) on February 17, 2026 of their intention to commence a tender offer to purchase a portion of outstanding shares of OBDC II in cash. The Purchasers subsequently notified Blue Owl Technology Income Corp. (“OTIC”) and Blue Owl Credit I...
-
Nuscale Power Corporation (SMR) Shareholders Who Lost Money – Contact Law Offices of Howard G. Smith About Securities Fraud Investigation
BENSALEM, Pa.--(BUSINESS WIRE)--Law Offices of Howard G. Smith announces an investigation on behalf of Nuscale Power Corporation (“Nuscale” or the “Company”) (NYSE: SMR) investors concerning the Company’s possible violations of federal securities laws. IF YOU ARE AN INVESTOR WHO SUFFERED A LOSS IN NUSCALE POWER CORPORATION (SMR), CONTACT THE LAW OFFICES OF HOWARD G. SMITH ABOUT POTENTIALLY PURSUING CLAIMS TO RECOVER YOUR LOSS. Contact the Law Offices of Howard G. Smith to discuss your legal rig...
-
Liquid Networx Announces Dedicated and Resident Fortinet Engineer Engagements for Enterprise Clients
SAN ANTONIO--(BUSINESS WIRE)--Liquid Networx, a national Fortinet partner and the first Fortinet Engage Preferred Services Partner (EPSP) in North America, is now offering dedicated and resident certified Fortinet engineers for enterprise clients. This offering delivers expert design, implementation, and ongoing support for Fortinet solutions including SASE, Zero Trust, and the Fortinet Security Fabric. The EPSP program endorses partners with verified capacities and experience in service delive...