

Newsroom
Sorted by: Latest
-
Section 232 Pharmaceutical Tariffs - Biocom Statement
SOUTH SAN FRANCISCO, Calif. & LOS ANGELES & SAN DIEGO--(BUSINESS WIRE)--Biocom, the largest life science membership association, representing companies across California and major life science markets, issued the following statement in response to the recent tariffs on patented pharmaceuticals and their ingredients under Section 232 of the Trade Expansion Act. This statement may be attributed to Tim Scott, president and CEO of Biocom: Biocom shares the Administration’s interest in protecting ou...
-
Mitchell Silberberg & Knupp Strengthens Entertainment Transactions Practice with Addition of New York Media & Entertainment Partner
NEW YORK--(BUSINESS WIRE)--Mitchell Silberberg & Knupp LLP (MSK) announced today that it has expanded its national Entertainment Transactions group with the addition of Amy Stein Simonds as a partner in its New York office. With more than a decade of experience, Stein Simonds joins from Pryor Cashman LLP, where she was a partner in the Media + Entertainment group. Stein Simonds brings deep expertise in production, financing, and distribution across film, television, podcasts, and digital me...

-
Honk and CurbsideSOS Combine to Accelerate Innovation in Roadside and Towing Services
CHICAGO--(BUSINESS WIRE)--Honk Technologies (“Honk”), the technology-enabled service provider transforming roadside assistance and vehicle logistics, today announced the sale of its business to Frontenac, a Chicago-based private equity firm. At the closing of this transaction, Honk completed a strategic add-on acquisition of CurbsideSOS, bringing together two companies focused on building the next generation of digital infrastructure for roadside assistance, accident management, and mobility se...
-
Bloom Energy Named to Newsweek’s 2026 List of America’s Most Trustworthy Companies
SAN JOSE, Calif.--(BUSINESS WIRE)--Bloom Energy (NYSE: BE), a global leader in power solutions, today announced it has been named to Newsweek’s 2026 list of America’s Most Trustworthy Companies, ranking no. 2 in the Energy & Utilities category. The recognition underscores the trust that Bloom has built over more than two decades by consistently delivering clean, reliable onsite power for customers. “Trust is built over time—and at Bloom, we’ve spent 25 years earning it,” said KR Sridhar, Fo...

-
Svante & Meadow Lake Tribal Council Partnership Agrees to Sell Microsoft 626,000 Tonnes of Carbon Removal Credits
VANCOUVER, British Columbia & MEADOW LAKE, Saskatchewan--(BUSINESS WIRE)--Svante Technologies Inc. (Svante) and Meadow Lake Tribal Council (MLTC) announced today that North Star Carbon Solutions LP has entered into an offtake agreement with Microsoft to deliver 626,000 tonnes of durable carbon dioxide removal (CDR) credits to be delivered over 15 years from the North Star bioenergy with carbon capture and storage (BECCS) project in Saskatchewan, Canada. The project is being developed through a...
-
Primient Launches New Biosolutions Business Unit to Accelerate Growth in the Bioeconomy
SCHAUMBURG, Ill.--(BUSINESS WIRE)--Primient, a global leader in biomanufacturing and plant-based ingredients, announced today the creation of a new Biosolutions business unit to accelerate growth in differentiated, high-value bio-based solutions for customers and innovators. In recent years, Primient has steadily expanded its role in the bioeconomy through strategic investments and partnerships that build on the company’s long-standing corn wet-milling heritage. Recent milestones include the Su...
-
CareQuest Institute Names An Nguyen, DDS, MPH, as Chief Clinical Officer
BOSTON--(BUSINESS WIRE)--CareQuest Institute Names An Nguyen, DDS, MPH, as Chief Clinical Officer...

-
Riassunto: Textron Aviation nomina cinque vincitori del 2026 Top Hawk, mentre il programma entra nel secondo decennio di impatto sulla forza lavoro
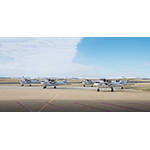
WICHITA, Kan.--(BUSINESS WIRE)--Textron Aviation Inc., un'azienda Textron Inc. (NYSE:TXT), oggi ha annunciato Brazos Valley Flight Services, Executive Air Taxi Corporation, Fairmont State University, Sterling Flight Training e Victors Aviation come destinatari del suo programma 2026 Top Hawk, continuando una tradizione che ha portato 55 velivoli Cessna Skyhawks nuovi di fabbrica in ambienti di addestramento a partire dal debutto del programma nel 2015. Con l'ingresso nel suo secondo decennio, T...
-
Textron Aviation anuncia los cinco ganadores del Top Hawk 2026 al iniciar la segunda década del programa
WICHITA, Kansas--(BUSINESS WIRE)--Textron Aviation Inc., empresa de Textron Inc. (NYSE: TXT), anunció hoy a Brazos Valley Flight Services, Executive Air Taxi Corporation, Fairmont State University, Sterling Flight Training y Victors Aviation como ganadores del programa Top Hawk 2026, reafirmando una trayectoria que, desde su lanzamiento en 2015, ya permitió incorporar 55 Cessna Skyhawks nuevos de fábrica a entornos de formación. En su segunda década, Top Hawk se consolida como una de las colabo...

-
Textron Aviation gibt fünf Preisträger des „Top-Hawk“-Programms 2026 bekannt, während das Programm in sein zweites Jahrzehnt als Förderer der Arbeitskräfte eintritt
WICHITA, Kansas--(BUSINESS WIRE)--Textron Aviation Inc., ein Unternehmen der Textron Inc. (NYSE:TXT), gab heute bekannt, dass Brazos Valley Flight Services, Executive Air Taxi Corporation, Fairmont State University, Sterling Flight Training und Victors Aviation die Empfänger des „Top- Hawk“-Programms 2026 sind. Damit wird eine Tradition fortgesetzt, in deren Rahmen seit dem Start des Programms im Jahr 2015 bereits 55 fabrikneue Cessna Skyhawks in Ausbildungsumgebungen eingesetzt wurden. Top Haw...
