Newsroom
Sorted by: Latest
-
GigaDevice élargit sa gamme de produits de communication optique avec les nouvelles séries de MCU GD32E512 et GD32E252 destinées aux modules optiques
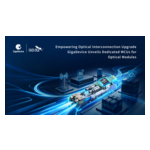
SINGAPOUR--(BUSINESS WIRE)--GigaDevice, une entreprise leader dans le domaine des semi-conducteurs, spécialisée dans les mémoires Flash, les microcontrôleurs (MCU) 32 bits, les capteurs et les produits analogiques, a lancé les nouvelles séries de MCU GD32E512 et GD32E252, spécialement conçues pour les applications de modules optiques. En tant que fournisseur de premier plan de MCU pour les applications de modules optiques, GigaDevice a toujours accordé une attention particulière au marché des c...

-
GigaDevice erweitert sein Portfolio für die optische Kommunikation um die neuen MCU-Serien GD32E512 und GD32E252 für optische Module
SINGAPUR--(BUSINESS WIRE)--GigaDevice, ein führendes Halbleiterunternehmen, das auf Flash-Speicher ,32-Bit-Mikrocontroller (MCUs), Sensoren und Analogprodukte spezialisiert ist, hat die neuen MCU-Serien GD32E512 und GD32E252 eingeführt. Sie sind für die Anwendung als optische Module konzipiert. Als führender Anbieter von Mikrocontrollern für optische Modulanwendungen hat GigaDevice seinen Fokus konsequent auf den Markt für optische Kommunikation ausgerichtet. Die Produktentwicklung wurde kontin...
-
ADMA Investors Have Opportunity to Lead ADMA Biologics, Inc. Securities Fraud Lawsuit with the Schall Law Firm
LOS ANGELES--(BUSINESS WIRE)--ADMA Investors Have Opportunity to Lead ADMA Biologics, Inc. Securities Fraud Lawsuit with the Schall Law Firm...
-
Venture Global und Atlantic-SEE geben die Ausweitung ihres langfristigen LNG-Kaufvertrags mit Griechenland bekannt
ARLINGTON, Va.--(BUSINESS WIRE)--Venture Global, Inc. (NYSE: VG) und ATLANTIC – SEE LNG TRADE S.A. aus Griechenland gaben eine Erweiterung ihres bestehenden Kaufvertrags (SPA) über den Bezug von Flüssigerdgas (LNG) aus den USA von Venture Global für einen Zeitraum von zwanzig Jahren ab 2030 bekannt. Im Rahmen der Vereinbarung verdoppelt Atlantic-SEE seinen bestehenden Vertrag mit Venture Global von mindestens 0,5 Millionen Tonnen pro Jahr (MTPA) auf 1,0 Millionen Tonnen pro Jahr (MTPA). Atlanti...
-
Samenvatting: Venture Global en Atlantic-SEE breiden langlopende overeenkomst uit voor de aan- en verkoop van LNG met Griekenland
ARLINGTON, Va.--(BUSINESS WIRE)--Vandaag hebben Venture Global, Inc. (NYSE: VG) en het Griekse ATLANTIC – SEE LNG TRADE S.A. bekendgemaakt dat zij hun bestaande koopovereenkomst (SPA) hebben uitgebreid voor de aankoop van vloeibaar aardgas (LNG) van Venture Global uit de VS. De aankoop gaat in 2030 van kracht en geldt voor een periode van twintig jaar. Deze bekendmaking is officieel geldend in de originele brontaal. Vertalingen zijn slechts als leeshulp bedoeld en moeten worden vergeleken met d...
-
ERAS Investors Have Opportunity to Lead Erasca, Inc. Securities Fraud Lawsuit with the Schall Law Firm
LOS ANGELES--(BUSINESS WIRE)--ERAS Investors Have Opportunity to Lead Erasca, Inc. Securities Fraud Lawsuit with the Schall Law Firm...
-
Rosen Law Firm Encourages GoDaddy Inc. Investors to Inquire About Securities Class Action Investigation – GDDY
NEW YORK--(BUSINESS WIRE)--Why: Rosen Law Firm, a global investor rights law firm, announces an investigation of potential securities claims on behalf of shareholders of GoDaddy Inc. (NYSE: GDDY) resulting from allegations that GoDaddy may have issued materially misleading business information to the investing public. So What: If you purchased GoDaddy securities you may be entitled to compensation without payment of any out of pocket fees or costs through a contingency fee arrangement. The Rose...
-
Next Health Announces Inaugural Longevity Summit in Nashville Featuring Leading Health Experts
NASHVILLE, Tenn.--(BUSINESS WIRE)--Next Health announces the South’s first Longevity Summit, bringing leading health and performance experts to Nashville on September 12....

-
VIA Investors Have Opportunity to Lead Via Transportation, Inc. Securities Fraud Lawsuit with the Schall Law Firm
LOS ANGELES--(BUSINESS WIRE)--VIA Investors Have Opportunity to Lead Via Transportation, Inc. Securities Fraud Lawsuit with the Schall Law Firm...
-
COOCON加入全球AI代理基金會(AAIF),推動AI代理支付和基於MCP的資料業務
韓國首爾--(BUSINESS WIRE)--(美國商業資訊)-- 韓國領先的商業資料平台公司COOCON(執行長:Kim Jong-hyun,KOSDAQ 294570)宣布,已於6月1日加入AI代理基金會(AAIF),成為銀牌會員。 AAIF是一個開源的代理式AI基金會,是Linux基金會旗下的全球聯盟,匯集了包括Anthropic、OpenAI、Google、Microsoft、Circle、Tron和Stripe在內的180多家成員公司。該基金會致力於開發和管理旨在增強AI代理互通性的開放標準和協議,在推動AI產業的全球標準化方面發揮了關鍵作用。 透過加入AAIF,COOCON計劃拓展其全球網路,並與首屈一指的AI代理公司進行更深入的合作。該公司亦計劃參加與AI代理支付和基於模型上下文協議(MCP)的AI資料業務相關的工作小組,來加強其技術基礎。透過這些舉措,COOCON力求在支付和資料技術領域獲得次世代能力,同時增強其在全球市場的競爭力。 隨著AI代理迅速發展,其功能已不僅限於產品搜尋與購買建議,更進一步延伸至實際支付環節;因此,支付服務供應商被寄予厚望,以期能成為核心基礎設...