

Newsroom
Sorted by: Latest
-
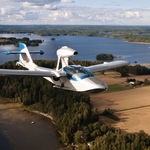
„Sensofusion“ pristato „Sensofusion Aviation“ – kovos su bepiločiais orlaiviais sistemas, skirtas naudoti ore
HELSINKIS--(BUSINESS WIRE)--Sparčiai auganti Suomijos gynybos technologijų įmonė „Sensofusion“ įsigijo Suomijos orlaivių gamintoją „Atol Aviation“. Įsigijusi šią gamintoją „Sensofusion“ grupė įgyja orlaivių ir bepiločių orlaivių gamybos patirties bei pajėgumų ir taip dar labiau išsiplečia įmonės galimybės vykdyti žvalgybą naudojant „oras–žemė“ jutiklius. „Atol Aviation“ vykdo veiklą Hali, Suomijoje, buvusioje Suomijos karinių oro pajėgų bazėje, kurioje įmonė sukūrė „Atol Aurora“ amfibinį orlaiv...

-
Sensofusion tutvustab Sensofusion Aviationit, mis viib droonitõrjesüsteemid taevasse
HELSINKI--(BUSINESS WIRE)--Kiiresti kasvav Soome kaitsetehnoloogiaettevõte Sensofusion omandas Soome lennukitootja Atol Aviation. Omandamine toob Sensofusioni kontserni lennukite ja mehitamata õhusõidukite tootmise alase oskusteabe ning tootmisvõimsused, laiendades veelgi ettevõtte suutlikkust teostada õhk-maa sensoripõhist luuret. Atol Aviation tegutseb Soomes Hallis endises Soome õhujõudude baasis, kus ettevõte on välja töötanud amfiiblennuki Atol Aurora ning ametkondlikuks ja kaitseotstarbel...
-
Taber, AB Named Winner of Kraft Hockeyville 2026
TORONTO--(BUSINESS WIRE)--Kraft Heinz, in partnership with the National Hockey League (NHL®) and the National Hockey League Players' Association (NHLPA), is pleased to announce that Taber, Alberta has been named the winner of Kraft Hockeyville 2026. Taber, Alberta will receive $250,000 for rink upgrades, plus the opportunity to host an NHL® Pre-Season game for their community in the fall of 2027. The runner-up, Tumbler Ridge, British Columbia, will be awarded $100,000 for rink upgrades—four tim...
-
Taber (Alberta) couronnée la grande gagnante de Kraft Hockeyville 2026
TORONTO--(BUSINESS WIRE)--Kraft Heinz, en partenariat avec la Ligue nationale de hockey (LNH®) et l’Association des joueurs de la Ligue nationale de hockey (AJLNH), est heureuse d’annoncer que Taber, en Alberta, a été nommée la grande gagnante de Kraft Hockeyville 2026. Taber, en Alberta, recevra 250 000 $ pour des améliorations à son aréna, en plus de la possibilité d’accueillir un match de présaison de la LNH® dans sa communauté à l’automne 2027. La municipalité finaliste, Tumbler Ridge, en C...
-
INSERTING and REPLACING Register for Galaxy Unpacked 2026 for a Chance to Win BTS Concert Tickets
TORONTO--(BUSINESS WIRE)--Samsung Electronics is counting down to Galaxy Unpacked 2026 and Canadians have an exciting reason to tune in....

-
Snowflake Inc. Class Action Reminder - Robbins LLP Encourages SNOW Stockholders to Contact the Firm for Information About Their Rights
SAN DIEGO--(BUSINESS WIRE)--Robbins LLP reminds stockholders that a class action was filed on behalf of all investors who purchased or otherwise acquired Snowflake Inc. (NYSE: SNOW) Class A common stock between June 27, 2023 and February 28, 2024. Snowflake is a software company that provides cloud data storage that enables customers to consolidate data onto data-driven applications and share data for the purpose of running analytics and other processes. For more information, submit a form, ema...

-
Molson Coors finalise l'acquisition d'Atomic Brands, fabricant des cocktails Monaco
CHICAGO--(BUSINESS WIRE)--Molson Coors Beverage Company (« Molson Coors » ou « la Société ») (NYSE : TAP, TAP.A) a finalisé l’acquisition d’Atomic Brands Inc., fabricant de Monaco Cocktails (« Monaco »), intègrant officiellement la marque dans son portefeuille américain élargi au-delà du rayon de la bière. Cette acquisition positionne Molson Coors parmi les cinq principaux fournisseurs du segment en forte croissance des cocktails prêts à consommer. La transaction étant désormais finalisée, Mols...
-
Corcept Therapeutics Incorporated Class Action Reminder – Robbins LLP Encourages CORT Stockholders to Contact the Firm for Information About Their Rights
SAN DIEGO--(BUSINESS WIRE)--Robbins LLP reminds stockholders that a class action was filed on behalf of all investors who purchased or otherwise acquired Corcept Therapeutics Incorporated (NASDAQ: CORT) common stock between October 31, 2024 and December 30, 2025. Corcept is a pharmaceutical company focused on the development of medications to treat severe endocrinologic, oncologic, metabolic and neurologic disorders by modulating the effects of the hormone cortisol.For more information, submit a...

-
uniQure N.V. Class Action Reminder – Robbins LLP Encourages QURE Stockholders to Contact the Firm for Information About Their Rights
SAN DIEGO--(BUSINESS WIRE)--Robbins LLP reminds stockholders that a class action was filed on behalf of all investors who purchased or otherwise acquired uniQure N.V. (NASDAQ: QURE) ordinary shares between September 24, 2025 and October 31, 2025. uniQure is a biotechnology company developing gene therapies for rare diseases.For more information, submit a form, email attorney Aaron Dumas, Jr., or give us a call at (800) 350-6003.What is the class period? September 24, 2025 – October 31, 2025What...

-
NuScale Power Corporation Class Action Reminder - Robbins LLP Encourages SMR Stockholders to Contact the Firm for Information About Their Rights
SAN DIEGO--(BUSINESS WIRE)--Robbins LLP reminds stockholders that a class action was filed on behalf of all investors who purchased or otherwise acquired NuScale Power Corporation (NYSE: SMR) Class A shares between May 13, 2025 and November 6, 2025. NuScale is a nuclear technology company focused on scalable, modular reactors.For more information, submit a form, email attorney Aaron Dumas, Jr., or give us a call at (800) 350-6003.What is the class period? May 13, 2025 – November 6, 2025What are...
