Newsroom
Sorted by: Latest
-
Kioxia Appoints Yoshihiko Kawamura as Chief Financial Officer
TOKYO--(BUSINESS WIRE)--Kioxia Holdings Corporation (TOKYO:285A), a world leader in memory solutions, today announced the appointment of Yoshihiko Kawamura as Chief Financial Officer (CFO), effective April 1, 2026. Mr. Kawamura brings extensive international experience to Kioxia, having held assignments at Mitsubishi Corporation’s U.S. headquarters, served as General Manager of its Chicago office, and completed a tenure at the World Bank. At Hitachi, Ltd., he held senior leadership positions, i...

-
Hurricane Electric Expands Network in South Africa With New Point of Presence at Open Access Data Centres DUR1 in Durban
DURBAN, South Africa--(BUSINESS WIRE)--Hurricane Electric, the world’s largest IPv6-native Internet backbone, announced today that it has established a new Point of Presence (PoP) at Open Access Data Centres DUR1, located at 3 Oppenheimer Road, Durban 4000, South Africa. OADC DUR1 offers a secure, carrier-neutral colocation environment with access to regional and international telecommunications providers and Internet exchanges. Situated in Durban, Africa’s busiest port city and a major commerc...

-
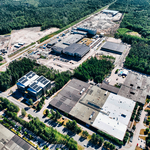
DNP Invests in Rapidus to Support the Establishment of Mass Production for Next-Generation Semiconductors
TOKYO--(BUSINESS WIRE)--DNP has participated in Rapidus Corporation’s funding round as one of the round investors....
-
Cowellnex and Metagen Launch Joint Research Utilizing Independently Acquired High‑Precision Gut Microbiota Data
TOKYO & YAMAGATA, Japan--(BUSINESS WIRE)--Cowellnex Co., Ltd. (Cowellnex)—jointly established by Kirin Holdings Company, Limited (Kirin Holdings)(TOKYO:2503) and Kyowa Kirin Co., Ltd. (Kyowa Kirin)—and Metagen, Inc. (Metagen), which promotes end-to-end innovation from gut environment R&D to social implementation, will begin joint research in February 2026 to develop new test items based on gut microbiota data from Japanese individuals, as well as an algorithm (mechanism) that proposes foods...

-
EdgeConneX planerar etablering i Sverige som del av europeisk expansionsstrategi för datacenter
STOCKHOLM & AMSTERDAM--(BUSINESS WIRE)--EdgeConneX®, ett EQT-portföljbolag med en omfattande plattform av datacenter i Europa, planerar att etablera sig i Sverige genom en ny satsning i Skellefteå. Datacenter-tomten kommer att förvärvas från Lyten, ett globalt bolag specialiserat på litium-svavelbatterier och energilagring. Etableringen är en del av EdgeConneX övergripande strategi att stärka den digitala infrastrukturen i Norden. Förutsatt att nödvändiga tillstånd beviljas och att de regulator...
-
EdgeConneX Looks to Enter Swedish Market as Part of European Data Center Expansion Strategy
STOCKHOLM & AMSTERDAM--(BUSINESS WIRE)--EdgeConneX®, an EQT portfolio company with an extensive Pan-European data center footprint, looks to expand its presence with a new site located in Skellefteå, Sweden. The data center site will be acquired from Lyten, a global company that specializes in lithium-sulfur batteries and energy storage. The site would support EdgeConneX broader strategy to expand digital infrastructure capacity across the Nordics. Subject to the completion of applicable admini...
-
UBS AG UK Regulatory Announcement: Changes to the UBS Board of Directors
ZURICH & BASEL, Switzerland--(BUSINESS WIRE)-- Ad hoc announcement pursuant to article 53 of the SIX Exchange Regulation Listing Rules The Board of Directors of UBS Group AG (NYSE:UBS) (SWX:UBSN) announces today the nomination of Agustín Carstens and Luca Maestri for election to the Board at the Annual General Meeting (AGM) on 15 April 2026. William C. Dudley and Jeanette Wong have decided not to stand for re-election. Agustín Carstens (born 1958) served as General Manager of the Bank of Inter...
-
Lyten Completes Acquisition of Northvolt Sweden and Establishes its First Lyten Industrial Hub in Sweden
SAN JOSE, Calif. & STOCKHOLM--(BUSINESS WIRE)--Lyten, a global leader in lithium-sulfur batteries and energy storage, announced today that it has completed the acquisition of Northvolt Ett and Ett Expansion (Skellefteå, Sweden) and Northvolt Labs (Västerås, Sweden). The Northvolt Sweden acquisition includes 16 GWh of existing battery manufacturing capacity, more than 160 hectares of land, infrastructure and buildings to support expanded manufacturing and industrial activities, and the largest a...
-
Okura Nikko Hotels Receives Top Honors in Forbes Travel Guide 2026
TOKYO--(BUSINESS WIRE)--Okura Nikko Hotels announces that three hotels earned Five-Star ratings and two hotels received Four-Star ratings in the 2026 Forbes Travel Guide....

-
OpenSynergy's Blue SDK Now Drives More Than 400 Million Cars
BERLIN--(BUSINESS WIRE)--OpenSynergy's Blue SDK, the industry-leading independent Bluetooth® stack, is now deployed in over 400 million cars. OpenSynergy is thrilled and very proud to announce that Blue SDK is now integrated in more than an estimated 400 million cars worldwide, deployed by virtually all the major OEMs across a wide range of vehicles, segments, and markets, offering extensive and consistent interoperability between many generations of smartphones and cars. “This is an incredible...