

Newsroom
Sorted by: Latest
-
Tigo Energy Adds Dynamic Rate Management for EI Residential Solar-Plus-Storage Solution in EU
LOS GATOS, Calif. & MONTEVARCHI, Italy--(BUSINESS WIRE)--Tigo Energy, Inc. (NASDAQ: TYGO) (“Tigo” or “Company”), a leading provider of intelligent solar and energy software solutions, today announced the addition of Dynamic Rate Management to the Tigo EI Residential solar-plus-storage solution. This new capability enables Tigo all-in-one ecosystem to intelligently respond dynamically to changes in electricity rates. This addition of Dynamic Rate Management comes at a time when European energy c...
-
GAUZ CLASS ACTION NOTICE: The Law Offices of Frank R. Cruz Files Securities Fraud Lawsuit Against Gauzy Ltd.
LOS ANGELES--(BUSINESS WIRE)--GAUZ CLASS ACTION NOTICE: The Law Offices of Frank R. Cruz Files Securities Fraud Lawsuit Against Gauzy Ltd....
-
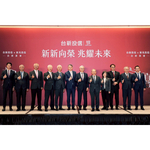
Merger Propels Taishin Securities Investment Trust into Top Ten with NT$1 Trillion Goal
TAIPEI, Taiwan--(BUSINESS WIRE)--Taishin Financial Holding and Shin Kong Financial Holding completed their merger on November 24, with their asset management subsidiaries—Taishin Securities Investment Trust Co. and Shin Kong Investment Trust Co.—becoming the first units to finalize integration. The surviving entity, Taishin Securities Investment Trust Co., now manages NT$530 billion in assets, ranking ninth in Taiwan and targeting NT$1 trillion in AUM. The new board elected Lai Chao-yin (賴昭吟) a...
-
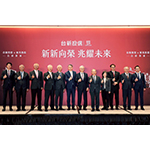
Taishin Securities Investment Trust Enters Top Ten After Merger, Sets Sights on NT$1 Trillion AUM
TAIPEI, Taiwan--(BUSINESS WIRE)--Taishin Financial Holding and Shin Kong Financial Holding completed their merger on November 24, with their asset management subsidiaries—Taishin Securities Investment Trust Co. and Shin Kong Investment Trust Co.—becoming the first units to finalize integration. The surviving entity, Taishin Securities Investment Trust Co., now manages NT$530 billion in assets, ranking ninth in Taiwan and targeting NT$1 trillion in AUM. The new board elected Lai Chao-yin (賴昭吟) a...

-
Post-Merger Taishin Securities Investment Trust Rises to Top Ten, Aims for NT$1 Trillion AUM
TAIPEI, Taiwan--(BUSINESS WIRE)--Taishin Financial Holding and Shin Kong Financial Holding completed their merger on November 24, with their asset management subsidiaries—Taishin Securities Investment Trust Co. and Shin Kong Investment Trust Co.—becoming the first units to finalize integration. The surviving entity, Taishin Securities Investment Trust Co., now manages NT$530 billion in assets, ranking ninth in Taiwan and targeting NT$1 trillion in AUM. The new board elected Lai Chao-yin (賴昭吟) a...
-
Toshiba Releases 40V Electronic Fuses (eFuse ICs) for Industrial and Consumer Applications
KAWASAKI, Japan--(BUSINESS WIRE)--Toshiba's new eFuse ICs feature a 40V rating and support a wide input voltage range, making them suitable for industrial and consumer applications....

-
東芝:産業・民生用機器向け40V耐圧の電子ヒューズ (eFuse IC) 発売について
川崎--(BUSINESS WIRE)--(ビジネスワイヤ) -- 東芝デバイス&ストレージ株式会社は、電源ラインの回路保護に必要なさまざまな機能を内蔵した電子ヒューズ(eFuse IC)のラインアップに、40V耐圧の「TCKE6シリーズ」を追加しました。新製品は、「TCKE601RA」、「TCKE601RL」、「TCKE602RM」、「TCKE603RA」、「TCKE603RL」の5品種で、本日より出荷を開始します。 新製品のTCKE6シリーズは、従来の物理ヒューズ[注1]が備えていた短絡保護機能に加え、物理ヒューズでは実現できなかった過電流、過電圧から回路を保護するための電流制限機能や、過電圧保護機能を搭載しています。これにより、異常な過電流や過電圧が発生した際にも、後段のICに規定を超える電流や電圧が加わるのを防ぎます。さらに、過熱保護機能も備えているため、回路に異常な熱が発生した場合や想定外の短絡状態となった場合でも、すぐにeFuse ICがオフとなり、後段の回路を保護することができます。また、ディスクリート半導体で設計する場合に比べて部品点数が少なく、設計の簡易化や回路面積...

-
Align Technology Announces Invisalign® System With Mandibular Advancement Featuring Occlusal Blocks for Class II Skeletal and Dental Correction
BANGKOK--(BUSINESS WIRE)--Align Technology, Inc. (Nasdaq: ALGN), a leading global medical device company that designs, manufactures, and sells the Invisalign® System of clear aligners, iTero™ intraoral scanners, and exocad™ CAD/CAM software for digital orthodontics and restorative dentistry, today announced commercial availability in Thailand of the Invisalign System with mandibular advancement featuring occlusal blocks designed specifically to address Class II skeletal and dental correction by...

-
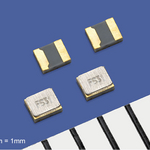
Riassunto: SII avvia la produzione di massa del “SC-10S”, il risonatore a cristalli al diapason più piccolo al mondo (1,0 × 0,8 × 0,32 mm)
CHIBA, Giappone--(BUSINESS WIRE)--Seiko Instruments Inc. (Presidente: Yoichi Endo; Sede: Chiba City, Chiba Prefecture; di seguito “SII”) avvierà la produzione di massa del “SC-10S” (32.768kHz), il risonatore a cristalli al diapason più piccolo* al mondo, che misura 1,0 × 0,8 mm, a partire dall'aprile 2026. *Basato sulla ricerca SII a novembre 2025. [Informazioni sullo sviluppo] SII ha già avviato la produzione di massa del “SC-12S” (32.768kHz), uno dei risonatori a cristalli al diapason più pic...
-
Resumen: SII comienza la producción en masa del resonador de cristal en forma de diapasón más pequeño del mundo (1,0 × 0,8 × 0,32 mm), el «SC-10S»
CHIBA, Japón--(BUSINESS WIRE)--Seiko Instruments Inc. (presidente: Yoichi Endo; sede central: ciudad de Chiba, prefectura de Chiba; en adelante, «SII») comenzará la producción en serie del «SC-10S» (32,768 kHz), el resonador de cristal en forma de diapasón más pequeño del mundo*, con unas dimensiones de 1,0 × 0,8 mm, a partir de abril de 2026. *Según datos de SII de noviembre de 2025. [Antecedentes del desarrollo] SII ya ha comenzado la producción en masa del «SC-12S» (32,768 kHz), uno de los r...
