Newsroom
Sorted by: Latest
-
Tidepool Showcases New Real-World Clinical Data and Landmark Women’s Health Initiative at ADA 2026
PALO ALTO, Calif.--(BUSINESS WIRE)--Tidepool, the nonprofit leader advancing innovation in diabetes technology, today unveiled new clinical insights and research initiatives in conjunction with the American Diabetes Association’s (ADA) 86th Scientific Sessions. The company’s presentation slate focuses on the immediate utility of real-world data and Tidepool’s ongoing commitment to closing gaps in women’s health research. Today’s insights demonstrate sustained progress in the adoption of accessi...
-
OrsoBio to Present Preclinical and Clinical Data from its Mitochondrial Protonophore Portfolio at the American Diabetes Association’s 2026 Scientific Sessions
MENLO PARK, Calif.--(BUSINESS WIRE)--At ADA 2026, OrsoBio to share clinical and preclinical data highlighting potential multi-system benefits of mitochondrial protonophore mechanism....
-
Verdiva Bio Presents Preclinical Data on Investigational Obesity Drug Candidates at the American Diabetes Association 86th Scientific Sessions
LONDON & SAN FRANCISCO--(BUSINESS WIRE)--Verdiva Bio Limited (“Verdiva Bio” or “the Company”), a clinical-stage biotechnology company advancing a scalable, once-weekly oral obesity product pipeline, today announced new preclinical data for VRB-103, a once-weekly oral amylin receptor-selective amylin analog, and VRB-104, a unimolecular amylin and GLP-1 receptor dual agonist. These data are being presented in poster sessions at the 86th Scientific Sessions of the American Diabetes Association (AD...
-
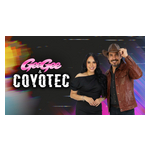
Entravision hace historia con el primer programa de radio en español copresentado por IA en EE. UU., "Al Aire y Sin Permiso"
BURBANK, Calif.--(BUSINESS WIRE)--Entravision Communications Corporation (NYSE: EVC), una empresa líder en tecnología de medios y publicidad, anunció el éxito del programa Al Aire y Sin Permiso en José 97.5 FM, en Los Ángeles. Este innovador programa, copresentado por GeeGee, natural de Los Ángeles, y Coyotec, el primer locutor de radio latino impulsado por IA del sector, ha contribuido a redefinir la radio en español al combinar tecnología de vanguardia con una auténtica conexión humana. El pr...
-
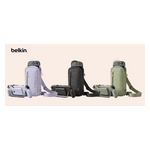
Belkin推出新款充电手柄和旅行包,进一步扩展Nintendo Switch 2配件生态系统
洛杉矶--(BUSINESS WIRE)--(美国商业资讯)-- 拥有40年历史的领先消费电子品牌Belkin今日宣布,推出 Nintendo Switch 2游戏充电手柄和Nintendo Switch 2游戏旅行包,进一步扩展其Nintendo Switch 2配件生态系统。 继获得殊荣的专业版充电盒于一月首次亮相后,这些全新配件进一步丰富了Belkin日益壮大的游戏产品线,为玩家提供了更多选择,无论身处何地,都能为游戏装备充电、提供保护并方便携带。 自2025年6月进军游戏配件领域以来,Belkin持续通过精心设计的产品扩展其生态系统,这些产品融合了优质材料、实用创新与值得信赖的性能。最新推出的产品旨在提升掌机游戏体验,让移动游戏变得比以往任何时候都更加轻松便捷。 Belkin未来事业部产品管理总监Logan Olson表示,”游戏业务是Belkin深耕移动电源和高端配件领域的自然延伸。自去年进军这一领域以来,我们一直致力于设计能够满足消费者实际需求的产品。这些新品的推出进一步扩展了我们的Nintendo Switch 2生态系统,为用户提供了更多舒适畅玩、随时充电以及安心出行的...
-
TVS HLX franchit la barre des 5 millions d'unités vendues dans le monde
BENGALURU, Inde--(BUSINESS WIRE)--TVS Motor Company (TVSM), filiale de TVS VENU et leader mondial des deux-roues et tricycles, a annoncé aujourd'hui que sa marque de motos utilitaires de confiance à l'échelle mondiale, la série TVS HLX, a franchi un cap important en vendant cinq millions d'unités à travers le monde. Lancée initialement en 2013 en Afrique, la série TVS HLX a contribué à transformer le quotidien de millions de personnes. Depuis 2013, la marque a suscité une forte adhésion et s'es...

-
SmartStop Self Storage Named One of Reviewed’s Best National Storage Chains of 2026
LADERA RANCH, Calif.--(BUSINESS WIRE)--SmartStop Self Storage REIT, Inc. (“SmartStop”) (NYSE: SMA), an internally managed real estate investment trust and a premier owner and operator of self-storage facilities in the United States and Canada, announced its inclusion in Reviewed’s Best National Storage Chains of 2026. Notably, SmartStop earned the distinction of being the highest-ranked publicly traded self-storage company on this year’s list. The annual rankings, determined by reader voting, s...
-
ベルキン、新たな充電グリップとトラベルバッグを投入し、Nintendo Switch 2向けアクセサリのエコシステムを拡充
ロサンゼルス--(BUSINESS WIRE)--(ビジネスワイヤ) -- 40年にわたりコンシューマー・エレクトロニクス分野をけん引してきたベルキンは本日、Nintendo Switch 2 対応ゲーミング充電グリップとNintendo Switch 2対応ゲーミングトラベルバッグを発売し、Nintendo Switch 2向けアクセサリのエコシステムを拡充すると発表しました。 1月に発表された、受賞歴を持つ「充電ケース Pro」に続く今回の新アクセサリは、ベルキンが拡充を進めるゲーミング・ポートフォリオをさらに広げるものです。プレイヤーは場所を問わず、ゲーミングに欠かせないアイテムを充電・保護・持ち運びできる選択肢をより多く手にできます。 2025年6月にゲーミング・アクセサリ分野へ参入して以来、ベルキンは上質な素材、実用性の高いイノベーション、信頼できる性能を兼ね備えた、細部まで考え抜かれた製品でエコシステムを広げてきました。今回加わる新製品は、携帯モードでのゲーム体験を高め、外出先でもこれまで以上に気軽にゲームを楽しめるよう設計されています。 ベルキンのFuture Vent...

-
Rosen Law Firm Urges GeneDx Holdings Corp. (NASDAQ: WGS) Stockholders to Contact the Firm for Information About Their Rights
NEW YORK--(BUSINESS WIRE)--Rosen Law Firm, a global investor rights law firm, announces a class action lawsuit on behalf of purchasers of common stock of GeneDx Holdings Corp. (NASDAQ: WGS) between April 16, 2025 and May 4, 2026. GeneDx describes itself as an “American biotechnology company specializing in genomic diagnostics, with a focus on whole genome sequencing and whole exome sequencing for the diagnosis of rare and inherited disorders.”For more information, submit a form, email attorney P...
-