

Newsroom
Sorted by: Latest
-
メディアリリース:2026年、生活費上昇による負担が強まる中、金銭面の不安が高まり、健康面の懸念と同水準に達する
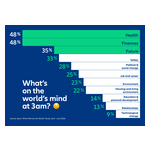
ミュンヘン--(BUSINESS WIRE)--(ビジネスワイヤ) -- 生活費上昇による負担は世界中の世帯にのしかかっており、金銭的な負担は日々の選択や将来への自信をますます左右しています。金銭面と健康面に関する不安は今や、世界全体で最大の不安要素としてそれぞれ48%で同率1位となり、将来への不安が35%で続いています。これは、10か国で実施され、The Allianz 3am Report 2026で発表された消費者調査によるものです。 金銭面の不安には、「生活費の上昇」(71%)と「収入不足」(51%)への懸念が含まれ、前年比で比較可能な8か国中7か国で高まりました。ブラジル、フランス、ドイツ、英国では3大不安項目のランキングで順位を上げた一方、イタリアでは横ばいでした。最も大きな上昇は、金銭面の懸念が引き続き最大の不安となっているオーストラリアとインドネシアで見られ、トルコでも42%から49%に上昇しました。今年の調査に新たに加わったスペインとスイスでも、金銭面の不安は上位2つの懸念事項に入っています。同時に、多くの人には、効果的に貯蓄し、資産を築き、長期的な経済的安定に向け...
-
Comunicado de prensa: Aumentan las preocupaciones económicas y ya están a la par de las relacionadas con la salud a medida que se intensifican las presiones del costo de vida en 2026
MÚNICH--(BUSINESS WIRE)--Los hogares de todo el mundo están sintiendo la presión del aumento del costo de vida y las dificultades económicas influyen cada vez más en las decisiones cotidianas, además de afectar la confianza a largo plazo. Las finanzas y la salud ya están en el mismo nivel de preocupación: son las dos inquietudes más importantes a nivel mundial, cada una con un 48 %, seguidas por la preocupación sobre el futuro, con un 35 %, según las encuestas a los consumidores realizadas en 1...

-
Rosen Law Firm Encourages Alarum Technologies Ltd. Investors to Inquire About Securities Class Action Investigation – ALAR
NEW YORK--(BUSINESS WIRE)--Why: Rosen Law Firm, a global investor rights law firm, announces an investigation of potential securities claims on behalf of shareholders of Alarum Technologies Ltd. (NASDAQ: ALAR) resulting from allegations that Alarum may have issued materially misleading business information to the investing public.So What: If you purchased Alarum securities you may be entitled to compensation without payment of any out of pocket fees or costs through a contingency fee arrangement...
-
KBRA Assigns Preliminary Ratings to LBA 2026-LBA6
NEW YORK--(BUSINESS WIRE)--KBRA announces the assignment of preliminary ratings to seven classes of LBA 2026-LBA6, a CMBS single-borrower securitization. The collateral for the transaction is a $950 million floating rate, interest-only mortgage loan. The loan is expected to have an initial two-year term with three, one-year extension options and require monthly interest-only payments. The loan will be secured by the borrower's fee simple interests in 39 industrial assets (98.1% of ALA), one off...
-
Former FHA Commissioner Frank Cassidy Rejoins Walker & Dunlop
BETHESDA, Md.--(BUSINESS WIRE)--Walker & Dunlop announced that Frank Cassidy has rejoined following his tenure as commissioner of FHA and assistant secretary for housing at HUD....

-
UL Solutions advierte sobre el uso no autorizado de las marcas UL en matafuegos a base de agua
NORTHBROOK, Illinois--(BUSINESS WIRE)--UL Solutions (NYSE: ULS), líder mundial en ciencia aplicada a la seguridad, emitió un aviso público sobre los matafuegos a base de agua Zinshine, los cuales llevan marcas de certificación UL no autorizadas para Estados Unidos y Canadá y podrían representar riesgos para la seguridad. Los productos afectados no han sido evaluados por UL Solutions de acuerdo con las normas de seguridad correspondientes, y se desconoce si cumplen algún requisito de seguridad....

-
Wolfgang Schmidt, ehemaliger Leiter des Bundeskanzleramts, wird Mitglied des europäischen Beirats von Planet
BERLIN--(BUSINESS WIRE)--Planet Labs Germany, ein führender Anbieter von täglichen Daten und Erkenntnissen zu Veränderungen auf der Erde, gab heute die Ernennung von Wolfgang Schmidt, ehemaliger Bundesminister für Sonderaufgaben und Leiter des Bundeskanzleramts, zum Mitglied seines europäischen Beirats bekannt. Er tritt dem Beirat zu einem entscheidenden Zeitpunkt bei, da Planet seine Präsenz in Europa ausbaut und Pläne für eine neue Satellitenfertigungsanlage in Berlin vorantreibt, was die wac...
-
MindWalk Holdings Corp. (NASDAQ : HYFT) intègre l’indice Russell 3000E, élargissant ainsi les opportunités d’investissement institutionnel
AUSTIN, Texas--(BUSINESS WIRE)--MindWalk Holdings Corp. (« MindWalk ») (NASDAQ : HYFT), société spécialisée dans l'intelligence artificielle bio-native, a annoncé aujourd'hui son intégration à l'indice Russell 3000E, après la clôture des marchés des États-Unis le 26 juin 2026, dans le cadre de la reconstitution semestrielle des indices Russell américains de FTSE Russell en juin 2026. Cette intégration a été confirmée dans les données de l'indice publiées le 29 juin 2026. L'indice Russell 3000E...
-
AGI Appoints Haaris Uddin as Chief Financial Officer
WINNIPEG, Manitoba--(BUSINESS WIRE)--Ag Growth International Inc. (TSX: AFN) (“AGI” or the “Company”) is pleased to announce the appointment of Haaris Uddin as Chief Financial Officer, effective August 4, 2026. Mr. Uddin will join AGI’s executive team and report directly to Paul Brisebois, AGI’s President and CEO. Interim CFO Nicolle Parker will continue to lead the finance function until the effective date to support a seamless transition. “Haaris brings strong public-company finance leadershi...
-
取引損失なしの取引プラットフォーム「UpsideOnly」、提供開始から数週間でユーザー数10万人を突破
サンフランシスコ--(BUSINESS WIRE)--(ビジネスワイヤ) -- Perpetuals.com Ltd(Nasdaq: PDC)は、取引損失を伴わない取引・市場予測プラットフォームであるUpsideOnlyで新規ユーザー登録が急増し、5月19日の提供開始から数週間でトレーダー数10万人という重要な節目に到達したと発表しました。 UpsideOnlyでは、ユーザーは自ら実際の取引を行うことなく、世界の株式、コモディティー、外国為替、暗号資産市場の方向性を予測できます。Perpetualsは、独自のAIが特定した最も有力なシグナルに基づき、自社資金で取引を行います。その取引で利益が出た場合、Perpetualsはシグナルの生成に貢献したユーザーに利益を分配します。取引で利益が出なかった場合でも、ユーザーが取引損失を被ることはありません。 提供開始からこれほど短期間でユーザー数10万人に到達したことは、従来の個人投資家向け取引モデルを根本から覆すプラットフォームに対する極めて大きな需要を反映しています。初期のプラットフォーム・データでは、資産クラス、地域、ユーザーの利用状況の...