

Newsroom
Sorted by: Latest
-
First Trust Global Funds PLC UK Regulatory Announcement: Net Asset Value(s)
LONDON--(BUSINESS WIRE)-- Funds Date TIDM ISIN Code Shares in Issue Currency Net Asset Value NAV/per Share First Trust US Momentum UCITS ETF 24.07.2026 FTMO.LN IE000CY30YV9 3,100,002.00 USD 94,404,178.84 30.453 ...
-
First Trust Global Funds PLC UK Regulatory Announcement: Net Asset Value(s)
LONDON--(BUSINESS WIRE)-- Funds Date TIDM ISIN Code Shares in Issue Currency Net Asset Value NAV/per Share First Trust SMID Rising Dividend Achievers UCITS ETF 24.07.2026 SDVI.LN IE000YVOQ2A3 40,361.00 USD 1,184,657.92 29.352 ...
-
First Trust Global Funds PLC UK Regulatory Announcement: Net Asset Value(s)
LONDON--(BUSINESS WIRE)-- Funds Date TIDM ISIN Code Shares in Issue Currency Net Asset Value NAV/per Share First Trust SMID Rising Dividend Achievers UCITS ETF 24.07.2026 SDVY.LN IE0001R850E1 15,204,007.00 USD 393,810,534.47 25.902 ...
-
First Trust Global Funds PLC UK Regulatory Announcement: Net Asset Value(s)
LONDON--(BUSINESS WIRE)-- Funds Date TIDM ISIN Code Shares in Issue Currency Net Asset Value NAV/per Share First Trust Growth Strength UCITS ETF 24.07.2026 FTGS.LN IE000YZLMXT9 25,002.00 USD 583,579.88 23.341 ...
-
First Trust Global Funds PLC UK Regulatory Announcement: Net Asset Value(s)
LONDON--(BUSINESS WIRE)-- Funds Date TIDM ISIN Code Shares in Issue Currency Net Asset Value NAV/per Share First Trust Vest U.S. Equity Moderate Buffer UCITS ETF - February 24.07.2026 GFEB.LN IE000X8M8M80 700,002.00 USD 27,465,889.57 39.237 ...
-
Qube Research & Technologies LTD UK Regulatory Announcement: Form 8.3 - Amendment
LONDON--(BUSINESS WIRE)-- FORM 8.3 AMENDMENT PUBLIC OPENING POSITION DISCLOSURE/DEALING DISCLOSURE BY A PERSON WITH INTERESTS IN RELEVANT SECURITIES REPRESENTING 1% OR MORE Rule 8.3 of the Takeover Code (the “Code”) 1. KEY INFORMATION (a) Full name of discloser: Qube Research & Technologies Limited (b) Owner or controller of interests and short positions disclosed, if different from 1(a): The naming of nominee or vehicle companies is insufficient. For a trust, the trustee(s), settlor and b...
-
Qube Research & Technologies LTD UK Regulatory Announcement: Form 8.3 - Amendment
LONDON--(BUSINESS WIRE)-- FORM 8.3 Amendment – this form replaces BusinessWire Notice 1598124, published at 12:45 on 24/07/26. Changes have been made to Section(s) 1(c), 2(a) and 3(b). PUBLIC OPENING POSITION DISCLOSURE/DEALING DISCLOSURE BY A PERSON WITH INTERESTS IN RELEVANT SECURITIES REPRESENTING 1% OR MORE Rule 8.3 of the Takeover Code (the “Code”) 1. KEY INFORMATION (a) Full name of discloser: Qube Research & Technologies Limited (b) Owner or controller of interests and short positio...
-
Qube Research & Technologies LTD UK Regulatory Announcement: Form 8.3 - Amendment
LONDON--(BUSINESS WIRE)-- FORM 8.3 AMENDMENT - this form replaces BusinessWire 1598123, published at 12:42 on 24/07/26. Changes have been made to Section(s) 1(c), 2(a) and 3(b). PUBLIC OPENING POSITION DISCLOSURE/DEALING DISCLOSURE BY A PERSON WITH INTERESTS IN RELEVANT SECURITIES REPRESENTING 1% OR MORE Rule 8.3 of the Takeover Code (the “Code”) 1. KEY INFORMATION (a) Full name of discloser: Qube Research & Technologies Limited (b) Owner or controller of interests and short positions disc...
-
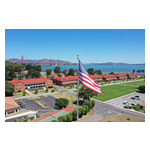
Presidio Trust Board Elects Lynne Benioff as Chair and Trevor Traina as Vice Chair
SAN FRANCISCO--(BUSINESS WIRE)--The Presidio Trust Board of Directors has elected Lynne Benioff as Board Chair and Trevor Traina as Vice Chair. The Presidio Trust is the innovative federal agency that manages the Presidio of San Francisco, one of the most visited national park sites in the United States, in partnership with the National Park Service.Lynne Benioff previously served on the Trust Board from 2015 to 2025 and was Board Chair from June 2021 to March 2023. She was also the co-chair of...
-
Havas Reports the Progress of Transactions Under Its Current Share Buyback Program
PARIS--(BUSINESS WIRE)--Havas reports the progress of transactions under its current share buyback program...