

Newsroom
Sorted by: Latest
-
Rosen Law Firm Encourages Huachen AI Parking Management Technology Holding Co., Ltd. Investors to Inquire About Securities Class Action Investigation – HCAI
NEW YORK--(BUSINESS WIRE)--Why: Rosen Law Firm, a global investor rights law firm, announces an investigation of potential securities claims on behalf of shareholders of Huachen AI Parking Management Technology Holding Co., Ltd. (NASDAQ: HCAI) resulting from allegations that Huachen AI may have issued materially misleading business information to the investing public. So what: If you purchased Huachen AI securities you may be entitled to compensation without payment of any out of pocket fees or...
-
Manhattan Associates, Inc. Investor News: Rosen Law Firm Announces Investigation of Breaches of Fiduciary Duties by the Directors and Officers of Manhattan Associates, Inc. – MANH
NEW YORK--(BUSINESS WIRE)--Rosen Law Firm, a global investor rights law firm, announces an investigation of potential breaches of fiduciary duties by the directors and officers of Manhattan Associates, Inc. (NASDAQ: MANH). If you currently own shares of Manhattan Associates stock, please visit the firm’s website at https://rosenlegal.com/submit-form/?case_id=35966 for more information. You may also contact Phillip Kim of Rosen Law Firm toll free at 866-767-3653 or via email at case@rosenlegal.c...
-
Airship扩充行业首创AI智能体集群,为企业带来目标优化能力
旧金山--(BUSINESS WIRE)--(美国商业资讯)-- 在奥兰多举行的Elevate’26大会上,移动优先客户体验公司Airship宣布,对其AI智能体集群进行重大扩充和升级。该集群是全球首个经过实际验证、测试和训练的多智能体集群,旨在推动持续目标优化并实现可衡量成果。本次里程碑式的发布推出了营销活动AI智能体,旨在帮助团队简化营销活动搭建、扩大内容生产规模并加速成果落地。 此次发布正值产品、营销和增长团队面临难以规模化打造个性化营销活动和开展增长实验的困境。Airship整合统一的客户数据和跨渠道编排能力,让团队能够通过直观的自然语言对话查看洞察和管理营销活动,同时实现持续的、基于目标的优化。Airship AI智能体集群无需开发人员参与,即可简化工作流程、消除产品路线图延误——将耗时数月的项目在数小时内转化为可衡量的成果。 Airship首席执行官Brett Caine表示:“Airship提供了首个内置多智能体协作能力的企业级平台,可实现大规模的自动化。我们的智能体AI已在当下为企业创造价值,并推动下一代客户体验发展。我们这款率先面市的专属智能体集群会主动围绕目标进行优...

-
Rosen Law Firm Encourages Skyline Builders Group Holding Limited Investors to Inquire About Securities Class Action Investigation – SKBL
NEW YORK--(BUSINESS WIRE)--Why: Rosen Law Firm, a global investor rights law firm, announces an investigation of potential securities claims on behalf of shareholders of Skyline Builders Group Holding Limited (NASDAQ: SKBL) resulting from allegations that Skyline Builders Group may have issued materially misleading business information to the investing public. So what: If you purchased Skyline Builders Group securities you may be entitled to compensation without payment of any out of pocket fee...
-
Airship擴充業界首創AI代理群集,為企業帶來目標最佳化能力
舊金山--(BUSINESS WIRE)--(美國商業資訊)-- 在奧蘭多舉行的Elevate’26大會上,行動優先客戶體驗公司Airship宣布,對其AI代理群集進行重大擴充和升級。該群集是全球第一個經過實際驗證、測試和訓練的多代理群集,旨在推動持續目標最佳化並實現可衡量成果。本次里程碑式的發表推出了行銷活動AI代理,旨在協助團隊簡化行銷活動建置、擴大內容生產規模並加快成果落地。 此次發表正值產品、行銷和成長團隊面臨難以規模化打造個人化行銷活動和展開業務成長實驗的困境。Airship整合統一的客戶資料和跨通路編排能力,讓團隊能夠透過直覺式的自然語言對話查看洞察和管理行銷活動,同時實現持續的、以目標為基礎的最佳化。Airship AI代理群集無需開發人員參與,即可簡化工作流程、消除產品路線圖延誤——將耗時數月的專案在數小時內轉化為可衡量的成果。 Airship執行長Brett Caine表示:「Airship提供了第一個內建多代理協作能力的企業級平台,可實現大規模的自動化。我們的代理式AI已在當下為企業創造價值,並推動下一代客戶體驗發展。我們這款率先上市的專用代理群集會主動圍繞目標進行...

-
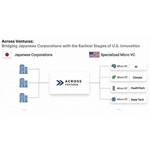
Across Ventures Launches Strategic Alliance with SBI Holdings to Establish New Micro VC-Focused Fund-of-Funds
SAN FRANCISCO--(BUSINESS WIRE)--Across Ventures, a Silicon Valley-based venture capital firm founded by Managing Partner, Emi Yoshikawa, today announced that it will enter into a strategic alliance with SBI Holdings, Inc., and will launch a new fund, Across Ventures Fund I, L.P. The fund is targeting approximately USD 100 million (approximately ¥16 billion) with an objective of connecting leading-edge U.S. innovation with Japanese enterprises. This fund will operate as a Fund-of-Funds with an i...
-
Faraday Future to Participate in and Host Upcoming New York Investor and Industry Events, Highlighting Its Broader Vision for EAI Mobility and Robotics
LOS ANGELES--(BUSINESS WIRE)--Faraday Future Intelligent Electric Inc. (NASDAQ: FFAI) ("Faraday Future," "FF" or "Company"), a California-based global shared intelligent electric mobility ecosystem company, today announced that its Global President, Jerry Wang, will participate in a series of upcoming investor and industry events in New York this April. FF will also showcase its cutting-edge electric vehicles and next-generation robotics technologies. Attendees will have the opportunity to expe...

-
Rosen Law Firm Encourages TJGC Group Limited Investors to Inquire About Securities Class Action Investigation – TJGC
NEW YORK--(BUSINESS WIRE)--Why: Rosen Law Firm, a global investor rights law firm, announces an investigation of potential securities claims on behalf of shareholders of TJGC Group Limited (NASDAQ: TJGC) resulting from allegations that TJGC may have issued materially misleading business information to the investing public. So what: If you purchased TJGC securities you may be entitled to compensation without payment of any out of pocket fees or costs through a contingency fee arrangement. The Ro...
-
Dallas Wings and GEICO Announce Multi-Year Partnership
NEW YORK--(BUSINESS WIRE)--The Dallas Wings and GEICO today announced a new multi-year partnership reflecting a shared commitment to women’s sports, youth development, and community impact across North Texas. As an Official Partner of the Dallas Wings, GEICO will play a role in enhancing the ways fans connect with the team throughout the season, including game‑day experiences, team storytelling, and youth engagement. GEICO will also serve as the Presenting Partner of Dallas Wings Youth Basketba...

-
LAKE DEADLINE NOTICE: Lakeland Industries, Inc. Investors Encouraged to Contact Kirby McInerney LLP By April 24, 2026
NEW YORK--(BUSINESS WIRE)--If you suffered a loss on your investment in Lakeland Industries, Inc. (“Lakeland” or the “Company”) (NASDAQ:LAKE), contact Lauren Molinaro by email at investigations@kmllp.com, or fill out the contact form below to discuss your rights or interests in the securities fraud class action lawsuit at no cost. Investors have until April 24, 2026 to ask the Court to appoint them as lead plaintiff. Courts do not consider applications filed after this deadline. The lead plaint...