

Newsroom
Sorted by: Latest
-
KnowBe4 lanza AIDA Orchestration como el primer agente totalmente autónomo para la gestión del riesgo humano
MEXICO CITY--(BUSINESS WIRE)--KnowBe4, la mundialmente reconocida plataforma de renombre mundial que aborda de manera integral la gestión de riesgos humanos y de agentes de IA, anunció hoy el lanzamiento de AIDA Orchestration, el octavo agente impulsado por IA en la suite de agentes de KnowBe4 para la gestión del riesgo humano conocida como AIDA (Artificial Intelligence Defense Agents). El agente AIDA Orchestration es un sistema autónomo basado en IA para la gestión del riesgo humano. Crea, pro...
-
KnowBe4 lança AIDA Orchestration como o primeiro agente totalmente autônomo para Gestão de Risco Humano
SÃO PAULO--(BUSINESS WIRE)--A KnowBe4, plataforma mundialmente reconhecida que aborda de forma abrangente a gestão de riscos humanos e de agentes de IA, anunciou hoje o lançamento do AIDA Orchestration. Este é o oitavo agente impulsionado por inteligência artificial na suíte de agentes da KnowBe4 para gestão de risco humano, conhecida como Artificial Intelligence Defense Agents (AIDA). O agente AIDA Orchestration é um sistema autônomo baseado em IA para a gestão de risco humano. A ferramenta cr...
-
KEYTRUDA® (pembrolizumab) Plus WELIREG® (belzutifan) Given as Adjuvant Therapy Reduced the Risk of Disease Recurrence or Death by 28% Compared to KEYTRUDA Monotherapy in Certain Patients With Earlier-Stage Renal Cell Carcinoma (RCC)
RAHWAY, N.J.--(BUSINESS WIRE)--KEY + WEL as Adjuvant Therapy Reduced the Risk of Disease Recurrence or Death Compared to KEYTRUDA Mono in Certain Patients With Earlier-Stage RCC...
-
WELIREG® (belzutifan) Plus LENVIMA® (lenvatinib) Reduced the Risk of Disease Progression or Death by 30% Compared to Cabozantinib in Certain Previously Treated Patients With Advanced Renal Cell Carcinoma (RCC)
RAHWAY, N.J. & NUTLEY, N.J.--(BUSINESS WIRE)--WELIREG Plus LENVIMA Reduced the Risk of Disease Progression or Death by 30% Compared to Cabozantinib in Certain Previously Treated RCC Patients...
-
Berkshire Hathaway Inc. News Release
OMAHA, Neb.--(BUSINESS WIRE)--(BRK.A; BRK.B) – Berkshire’s operating results for the fourth quarter and full year of 2025 and 2024 are summarized in the following paragraphs. However, we urge investors and reporters to read our 2025 Annual Report, which has been posted at www.berkshirehathaway.com. The limited information that follows in this press release is not adequate for making an informed investment judgment. Earnings of Berkshire Hathaway Inc. and its consolidated subsidiaries for the fo...
-
The Cannabist Company Further Extends Forbearance Agreement With Senior Noteholders
CHELMSFORD, Mass.--(BUSINESS WIRE)--The Cannabist Company Holdings Inc. (Cboe CA: CBST) (OTCQB: CBSTF) (“The Cannabist Company” or the “Company”), one of the most experienced cultivators, manufacturers, and retailers of cannabis products in the United States, today announced that the ad hoc group of noteholders of the Company’s 9.25% Senior Secured Notes due December 31, 2028 and the 9.00% Senior Secured Convertible Notes due December 31, 2028 (collectively, the “Notes”), which are parties to t...
-
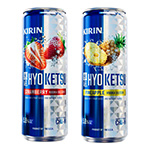
KIRIN HYOKETSU Expands into U.S. RTD Market with Local Production
TOKYO--(BUSINESS WIRE)--New Belgium Brewing, the Kirin Group company leading its U.S. alcoholic beverage business, will launch two original flavors - KIRIN HYOKETSU STRAWBERRY and KIRIN HYOKETSU PINEAPPLE – under the KIRIN HYOKETSU (HYOKETSU) brand, manufactured and sold by Kirin Brewery Company, Limited (Kirin Brewery). The ready to drink cocktail will be available in Hawaii, Tampa, FL, and The Japan Pavilion at EPCOT theme park, operated by Mitsukoshi (U.S.A.), on March 2. Created with Americ...
-
CWH INVESTOR ALERT: Kirby McInerney LLP Investigates Potential Claims Involving Camping World Holdings, Inc.
NEW YORK--(BUSINESS WIRE)--The law firm of Kirby McInerney LLP continues its investigation on behalf of Camping World Holdings, Inc. (“Camping World” or the “Company”) (NYSE:CWH) investors concerning the Company’s and/or members of its senior management’s possible violation of the federal securities laws and other unlawful business practices. [LEARN MORE ABOUT THE INVESTIGATION] What Happened? On October 28, 2025, Camping World issued a press release announcing its third-quarter 2025 financial...
-
REMINDER: Coreweave, Inc. Investors With Significant Losses Must Act By March 13, 2026
NEW YORK--(BUSINESS WIRE)--Kirby McInerney LLP reminds Coreweave, Inc. (“Coreweave” or the “Company”) (NASDAQ:CRWV) investors of the March 13, 2026 deadline to seek the role of lead plaintiff in a pending federal securities class action. Courts do not consider applications filed after this deadline. The lead plaintiff oversees the litigation on behalf of the class and may influence key decisions, including litigation strategy and settlement. Courts regularly appoint individual investors as lead...
-
EPAM SYSTEMS, INC. INVESTOR ALERT: Kirby McInerney LLP Announces Investigation Into Potential Securities Fraud
NEW YORK--(BUSINESS WIRE)--The law firm of Kirby McInerney LLP is investigating potential claims against EPAM Systems, Inc. (“EPAM” or the “Company”) (NYSE:EPAM). The investigation concerns whether the Company and/or members of its senior management may have violated federal securities laws or engaged in other unlawful business practices. [LEARN MORE ABOUT THE INVESTIGATION] What Happened? On February 19, 2026, EPAM reported its financial results for fourth quarter and full year 2025. On an ear...