Newsroom
Sorted by: Latest
-
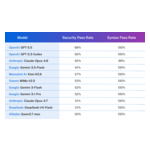
Gli LLM stanno diventando sempre più intelligenti, ma non più sicuri: il 2026 GenAI Code Security Report di Veracode rivela che la sicurezza del codice generata dall'AI è ferma alla percentuale di superamento del 56%
BURLINGTON, Mass.--(BUSINESS WIRE)--Veracode, il leader globale nella gestione del rischio applicativo, oggi ha rilasciato il suo 2026 GenAI Code Security Report (Rapporto 2026 sulla sicurezza del codice della GenAI), secondo il quale nonostante i rapidi progressi nelle capacità di codifica dell'AI, la sicurezza è rimasta indietro. In quattro immagini di prova e oltre 100 modelli tracciati fin dagli inizi del programma, la percentuale media di superamento della sicurezza si ferma al 56%, virtua...
-
Dropzone AI Makes AI Threat Hunter Generally Available, Bringing Proactive Threat Hunting to Every SOC
SEATTLE--(BUSINESS WIRE)--Dropzone AI announces the general availability of AI Threat Hunter, a proactive agent helping security teams uncover hidden threats and coverage gaps....
-
Xfinity Powers the Next Generation of Creators With “Best in Class”
PHILADELPHIA--(BUSINESS WIRE)--Xfinity today announced “Best in Class,” a new vertical reality competition series made exclusively for Instagram and TikTok that brings together six rising college creators to compete for a six-figure Xfinity brand partnership. As connectivity becomes the foundation of modern creativity, Xfinity is investing in the next generation of talent through original social-first programming that celebrates the ambition and entrepreneurial spirit shaping today’s creator ec...

-
Graham Packaging Company Inc. to Review 2026 Second Quarter Results on July 31, 2026
LANCASTER, Pa.--(BUSINESS WIRE)--Graham Packaging Company Inc. will host a conference call on Friday, July 31, 2026, at 9:00 AM EDT / 8:00 AM CDT / 13:00 UTC to review its financial results for the quarter ended June 30, 2026. The call will include prepared remarks and a question and answer session. Dial-in information and the presentation materials will be available to only our current investors, after approximately 7:00 pm ET on July 30, 2026, through the Syndtrak site managed by Wells Fargo,...
-
DemandScience and ZoomInfo Announce Strategic Partnership to Deliver Industry-Leading Marketing Insights and Outcomes
VANCOUVER, Wash.--(BUSINESS WIRE)--DemandScience and ZoomInfo, leaders in B2B marketing intelligence and sales acceleration, today announced a strategic partnership that combines ZoomInfo's comprehensive data architecture with DemandScience's award-winning marketing outcomes expertise to deliver unprecedented insights and measurable business impact. Under the partnership, DemandScience is architecting its suite of insights, services, and outcomes solutions to complement ZoomInfo's platform, whi...
-
Xcel Energy Elects Peter Carter to Board of Directors
MINNEAPOLIS--(BUSINESS WIRE)--Xcel Energy (NASDAQ: XEL) announced that Peter Carter has been elected to its board of directors, effective today. Carter serves as the president of Delta Air Lines, where he drives the company’s enterprise strategy, global policy matters and global market position. He plays a central role in shaping and protecting Delta’s ability to compete, grow and innovate. Under Peter’s leadership, Delta collaborates with industry stakeholders to deliver a more sustainable fut...

-
What Rugs.com Wants You to Know About Washable Rugs Before You Commit to The Newest Rug Trend
FORT MILL, S.C.--(BUSINESS WIRE)--Rugs.com expands its washable rug collection to over 4,000 styles. Explore the collection at www.rugs.com....

-
شركة AUTOBACS SEVEN تحتفي بمرور 10 سنوات من استقرار الأنظمة والابتكار المموَّل ذاتيًا بالتعاون مع Rimini Street
لاس فيجاس--(BUSINESS WIRE)--أعلنت اليوم شركة Rimini Street, Inc. (بورصة ناسداك: RMNI)، المتخصصة في دعم البرمجيات وأنظمة ERP المدعومة بالذكاء الاصطناعي الوكيلي™، والرائدة في توفير خدمات الدعم الخارجي لبرمجيات Oracle وSAP وVMware، أنَّ شركة AUTOBACS SEVEN Co., Ltd. تحتفل بمرور 10 سنوات على شراكتها مع Rimini Street، في إنجاز يعكس عقدًا من استقرار العمليات الأساسية وإعادة الاستثمار في الابتكار.يتناول هذا البيان الصحفي الوسائط المتعددة. يمكنك الاطلاع على البيان كاملاً هنا: https://www.businesswire....

-
NATIXIS UK Regulatory Announcement: Form 8.3
LONDON--(BUSINESS WIRE)-- FORM 8.3 PUBLIC OPENING POSITION DISCLOSURE/DEALING DISCLOSURE BY A PERSON WITH INTERESTS IN RELEVANT SECURITIES REPRESENTING 1% OR MORE Rule 8.3 of the Takeover Code (the “Code”) 1. KEY INFORMATION (a) Full name of discloser: NATIXIS SA (b) Owner or controller of interests and short positions disclosed, if different from 1(a): The naming of nominee or vehicle companies is insufficient. For a trust, the trustee(s), settlor and beneficiaries must be named. (c) Name o...
-
Nebius Group announces date of second quarter 2026 results and conference call
AMSTERDAM--(BUSINESS WIRE)--Nebius Group N.V. (“Nebius Group” or the “Company”; Nasdaq: NBIS), will release its second quarter 2026 financial results on Wednesday, August 12, 2026, before market open. Nebius Group will also hold a conference call to discuss its results at 8:00 a.m. Eastern Time (5:00 a.m. Pacific Time / 2:00 p.m. Central European Time) on the same day. The registration link to access the webcast and its replay will be available on Nebius Group’s Investor Relations website at ht...