

Newsroom
Sorted by: Latest
-
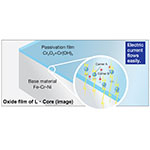
NIPPON KINZOKU加强推广环保型产品 “L-Core”:通过表面改性技术实现高导电性的功能性不锈钢
东京--(BUSINESS WIRE)--(美国商业资讯)-- NIPPON KINZOKU CO., LTD.(东京证券交易所代码:5491,总部位于东京都港区)宣布,将进一步加强推广其环保型产品"L-Core,"L-Core是一种功能性不锈钢,通过公司自主研发的表面改性技术,在保持不锈钢原有耐腐蚀性能的同时,实现了极低的接触电阻。公司已将L-Core重新定位为战略性“环保产品”,以支持可持续制造。 通过将高性能特性直接赋予基材本身,客户可省去多余的加工步骤,并提升材料利用率。这一方案不仅能够简化制造流程,还可降低整个供应链中的环境负荷,助力实现碳中和社会。 1. 技术特点:形成“载流子掺杂”(导电通路) 通过自主开发的表面处理技术,公司可在不锈钢钝化膜内部形成“载流子掺杂”区域,使其成为电流传导通路。 兼顾导电性与耐腐蚀性:该技术是在不破坏钝化膜的前提下对其进行改性,因此能够保留不锈钢原有的优异耐腐蚀性能。 无需后续加工:由于材料本身已具备低电阻特性,因此在导电部件应用中,无需再进行镀层等额外工序。 2. 性能数据:优异的接触电阻与长期稳定性 L-Core展现出与半光亮镍镀层相当的...

-
Origin Lab Raises $8M Seed Led by Lightspeed to Build the Platform Turning Video Game Worlds Into Training Data for AI
SAN FRANCISCO--(BUSINESS WIRE)--Origin Lab, the technology platform turning licensed game worlds into structured training data for world models and multimodal AI, today announced an $8M seed round led by Lightspeed Venture Partners. The financing will accelerate Origin Lab’s software, capture, enrichment, QA, search, and delivery systems, while expanding its applied research work in world understanding, dataset intelligence, and interactive simulation. SV Angel, Eniac, Seven Stars, FPV and ange...

-
Sherritt Provides Update on Various Matters including Resignation of CFO and Auditor
TORONTO--(BUSINESS WIRE)--Sherritt International Corporation (“Sherritt” or the “Corporation”) (TSX:S) announces that Deloitte LLP has formally resigned as the Corporation’s external auditor, effective May 12, 2026. The resignation was not the result of any disagreement between the Corporation and Deloitte on any matter of accounting principles or practices, financial statement disclosure, or auditing scope or procedure. Deloitte’s reports on the Corporation’s previously issued financial statem...
-
NIPPON KINZOKU treibt die Vermarktung von „L-Core“ als Ökoprodukt voran: Funktionaler Edelstahl mit hoher Leitfähigkeit durch Oberflächenmodifizierung
TOKIO--(BUSINESS WIRE)--NIPPON KINZOKU CO., LTD. (TOKYO: 5491) (Hauptsitz: Minato-ku, Tokio) hat die verstärkte Vermarktung des funktionalen Edelstahls „L-Core“ bekannt gegeben. Dieser nutzt eine proprietäre Oberflächenmodifikationstechnologie, um einen extrem niedrigen Kontaktwiderstand zu realisieren und zugleich die inhärente Korrosionsbeständigkeit von Edelstahl zu erhalten. Um eine nachhaltige Fertigung zu fördern, wurde L-Core als strategisches Ökoprodukt neu positioniert. Indem wir die H...
-
Riassunto: Boomi e Red Hat colaborano alla produzione dell'IA agenziale pronta alla produzione
CONSHOHOCKEN, Pennsylvania--(BUSINESS WIRE)--Boomi, l'azienda di attivazione dati per l'IA, e Red Hat, il fornitore leader mondiale di soluzioni open source, hanno annunciato oggi una collaborazione strategica per offrire un unico stack integrato per la distribuzione di IA agenziale su larga scala. Per molte organizzazioni, lo sviluppo di IA per produzione oggi significa mettere insieme una serie di soluzioni di fornitori slegate tra loro, che vanno dai generatori di agenti agli strumenti di or...
-
Boomi e Red Hat cooperam em IA agêntica pronta para produção
CONSHOHOCKEN, Pensilvânia--(BUSINESS WIRE)--Boomi, empresa especializada em ativação de dados para IA, e Red Hat, líder mundial em soluções de código aberto, anunciaram hoje uma cooperação estratégica, a fim de oferecer uma plataforma única e integrada para implementar a IA agêntica em larga escala. Para muitas organizações, criar IA de produção hoje significa reunir inúmeras opções de fornecedores desconectados, abrangendo criadores de agentes, ferramentas de orquestração, plataformas de gover...
-
Boomi et Red Hat s’associent pour développer une IA agentique prête à l’emploi
CONSHOHOCKEN, Pennsylvanie--(BUSINESS WIRE)--Boomi, spécialiste de l’activation des données pour l’IA, et Red Hat, leader mondial des solutions open source, ont annoncé aujourd’hui une collaboration stratégique visant à fournir une pile unique et intégrée pour le déploiement à grande échelle de l’IA agentique. Pour de nombreuses organisations, mettre en place une IA en production implique aujourd’hui d’assembler de nombreux choix de fournisseurs disparates, allant des générateurs d’agents aux o...
-
Boomi y Red Hat colaboran en el desarrollo de una IA agéntica lista para producción
CONSHOHOCKEN, Pensilvania--(BUSINESS WIRE)--Boomi, la empresa de activación de datos para la IA, y Red Hat, el proveedor líder mundial de soluciones de código abierto, anunciaron hoy una colaboración estratégica para ofrecer una pila única e integrada que permita implementar IA agéntica a gran escala. Para muchas organizaciones, desarrollar IA para la producción hoy en día implica reunir numerosas opciones de proveedores inconexas que abarcan creadores de agentes, herramientas de orquestación,...
-
Samenvatting: Boomi en Red Hat werken samen aan productieklaar agentgebaseerde AI
CONSHOHOCKEN, Pa.--(BUSINESS WIRE)--Boomi, het bedrijf voor gegevensactivering, gespecialiseerd in AI en Red Hat, 's werelds toonaangevende leverancier van open-sourceoplossingen, heeft vandaag een strategische samenwerking aangekondigd om één geïntegreerde stack te bieden voor de grootschalige implementatie van agentic AI. Voor veel organisaties betekent het opzetten van productie-AI tegenwoordig dat ze talrijke losstaande oplossingen van verschillende leveranciers moeten samenvoegen. Dit vari...
-
Boomi und Red Hat kooperieren bei produktiver agentischer KI
CONSHOHOCKEN, Pennsylvania--(BUSINESS WIRE)--Boomi, das Datenaktivierungsunternehmen für KI, und Red Hat, der weltweit führende Anbieter von Open-Source-Lösungen, gaben heute eine strategische Zusammenarbeit bekannt, die darauf ausgerichtet ist, einen einzigen, integrierten Technologie-Stack zur Bereitstellung agentischer KI in großem Maßstab zu liefern. Um derzeit eine produktive KI aufzubauen, müssen Unternehmen häufig eine Vielzahl voneinander unabhängiger Anbieterlösungen zusammenführen, wi...